
AI Visibility in the dashboard
AI Visibility shows how often AI assistants name your business when people ask them for a recommendation. We ask each assistant the same set of questions on a schedule, daily for most businesses, and record whether you’re named, where you’re named, and who’s named instead.
It has two tabs. Tracking is what the assistants say about you. AI Traffic is the visitors they send to your website.
How we measure it
Section titled “How we measure it”- The questions are the ones your customers ask, chosen for your business and set to your city. Each question is asked several ways (we call each one a phrasing), and the dashboard pools them into one row, because people word the same question differently.
- The assistants are ChatGPT, Gemini, Perplexity, Claude, and Copilot. ChatGPT, Gemini, and Copilot answers come from the same apps your customers use. Perplexity and Claude answer through their own models with web search on.
- When is every morning for most businesses. Claude is asked once a week, and Copilot only gets the recommendation questions.
- Named means the assistant mentioned your business by name in its answer, or, for ChatGPT, Gemini, and Copilot, cited your website as a source.
The same question can get a different answer from one run to the next, so no single answer means much on its own. Every number here pools all the answers in the range, and changes too small to rule out chance show in gray.
Tracking
Section titled “Tracking”Pick 7, 30, or 90 days at the top right.
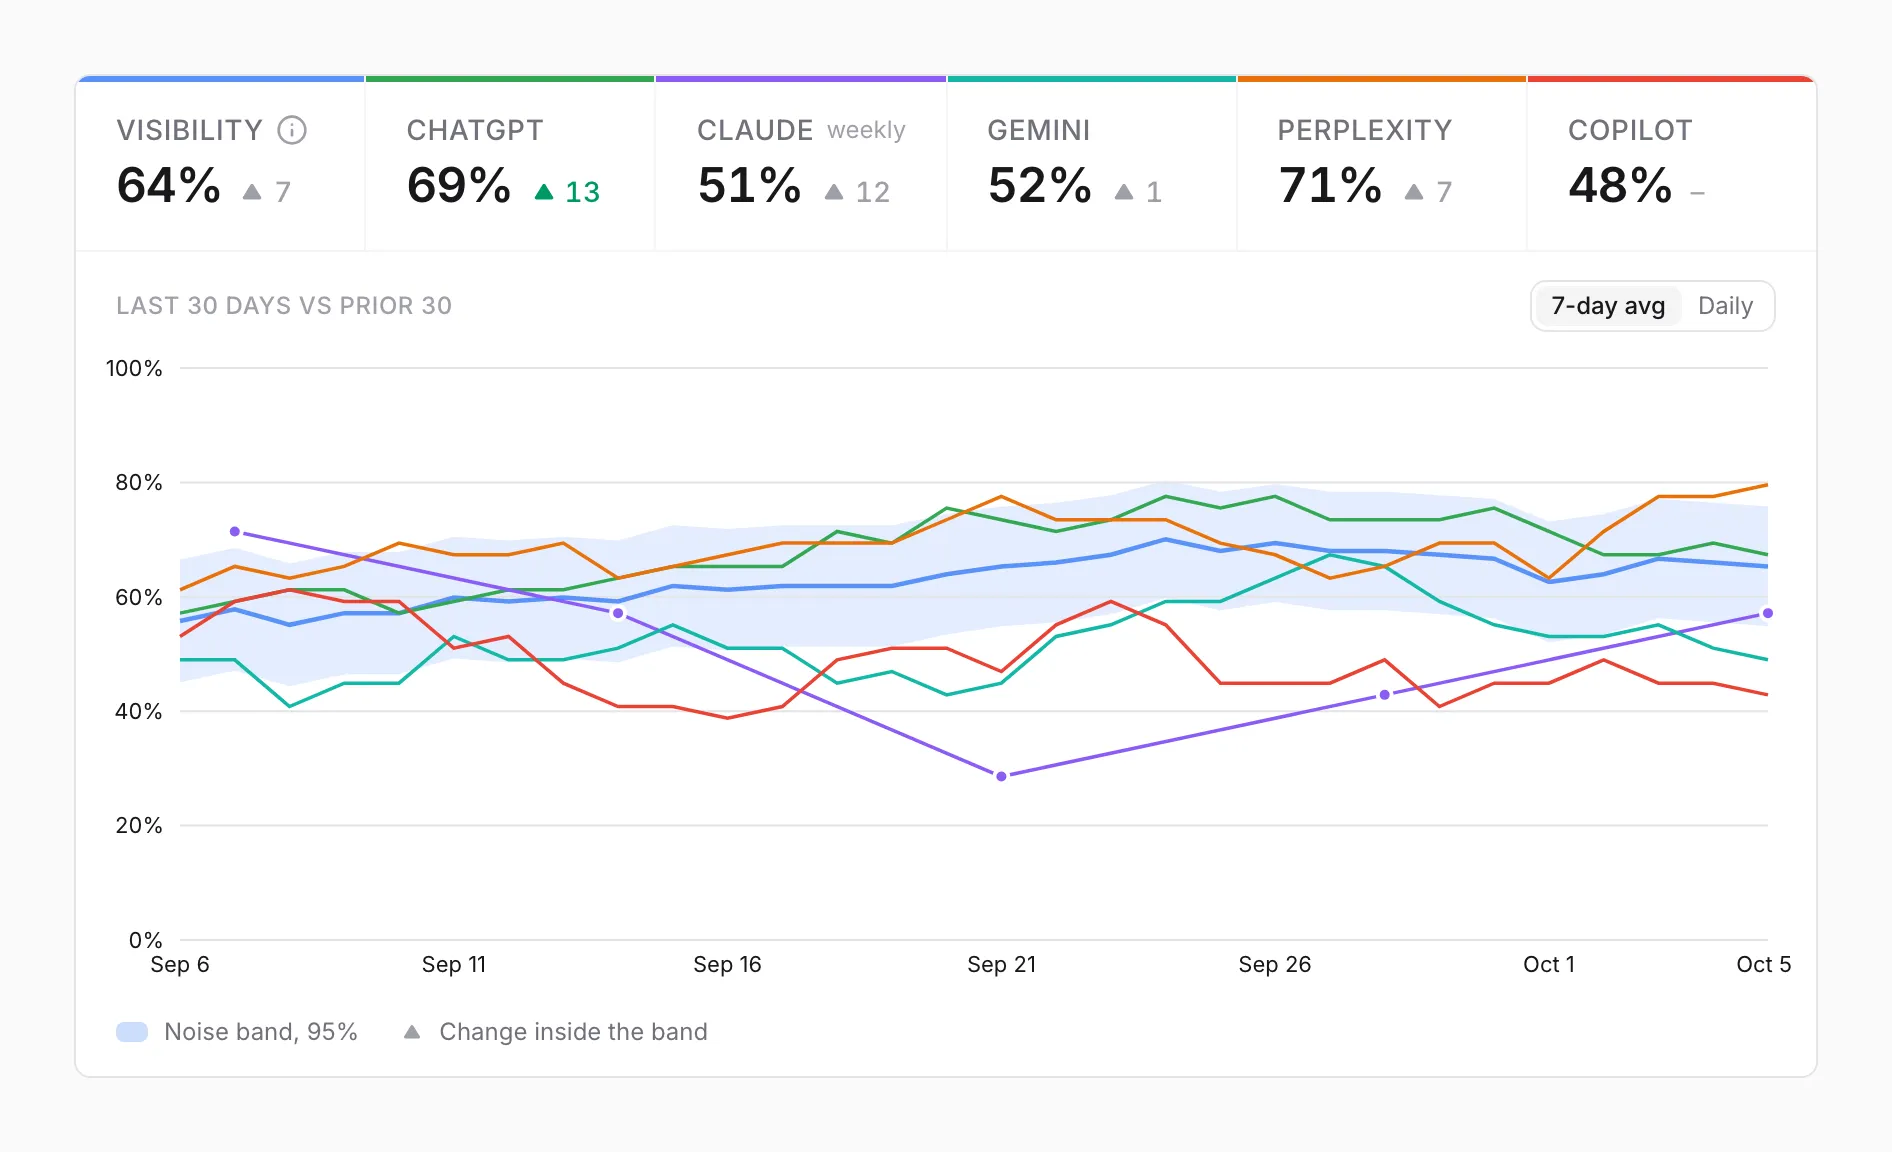
| Tile | Shows |
|---|---|
| Visibility | How often ChatGPT, Gemini, and Perplexity named you, across every question and phrasing in the range |
| ChatGPT, Gemini, Perplexity | The same rate for each assistant on its own |
| Claude | Its own rate, from the weekly run |
| Copilot | Its own rate, when Copilot has answers in the range |
A dash means that assistant wasn’t asked in the range, not that it never named you. Click a tile to show or hide its line on the chart.
The chart shows the 7-day average by default, which smooths out day-to-day swings. Switch to Daily at its top right to see each day. The shaded band is the range a rate could move by chance alone, so a change inside it isn’t a real change yet.
Questions
Section titled “Questions”One row per question, however many ways it’s asked, grouped by city.
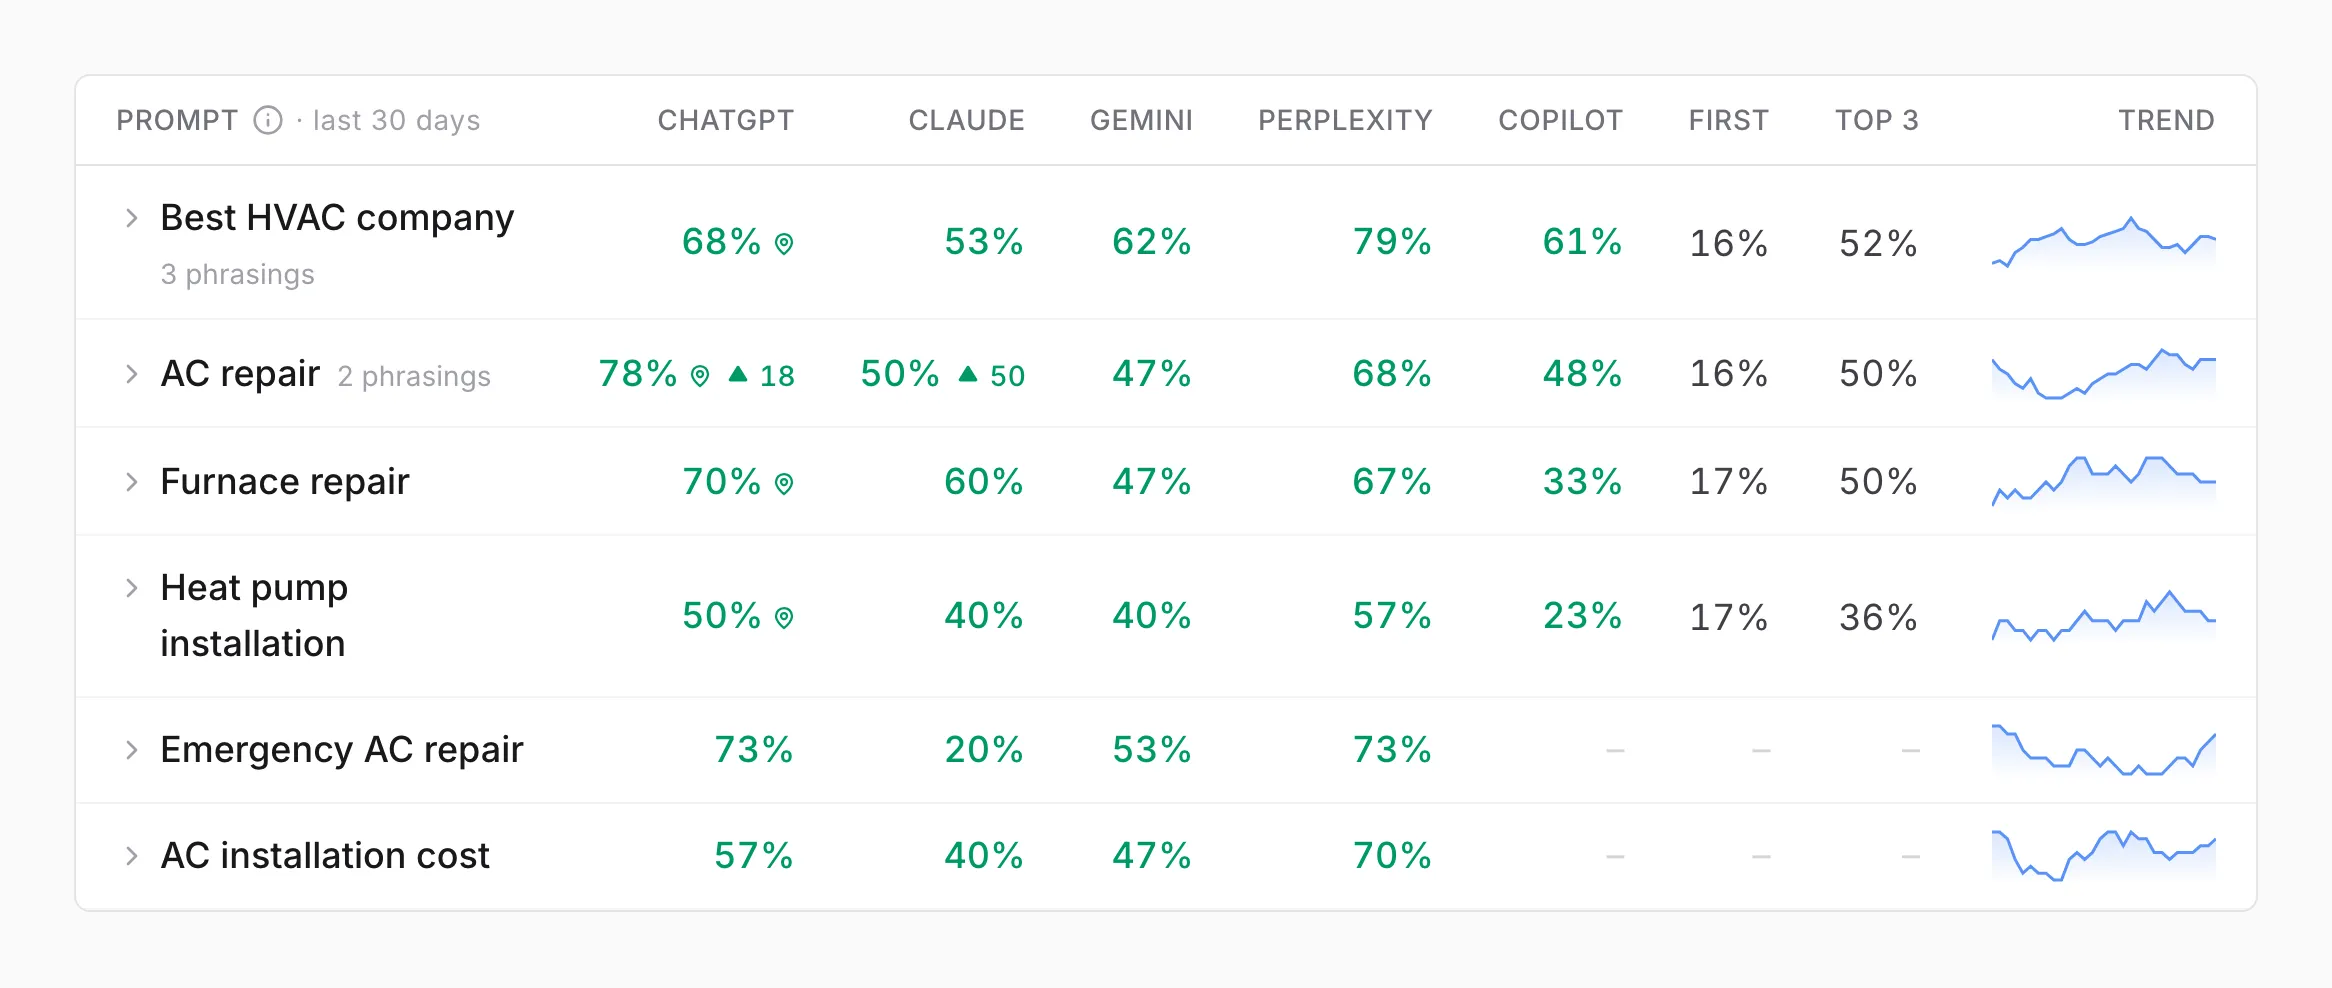
- Each assistant’s column is how often it named you for that question. A pin next to a ChatGPT number means ChatGPT also showed a card of local businesses for that question. Hover over it to see how often you were in the card.
- First is how often you were the first business named, and Top 3 how often you were among the first three, across ChatGPT, Gemini, and Perplexity.
- Trend is the question’s rate over time.
This table always covers at least 30 days, even when you pick 7, so each question has enough answers to read.
Click a question to see each way it’s asked, then click a phrasing to read the latest answers. For each assistant, you’ll see whether it named you, the sentence that did, the full answer, the businesses in its card or list, the websites it cited, and the searches it ran to answer.
Where you stand
Section titled “Where you stand”How you compare with every other business the assistants named.
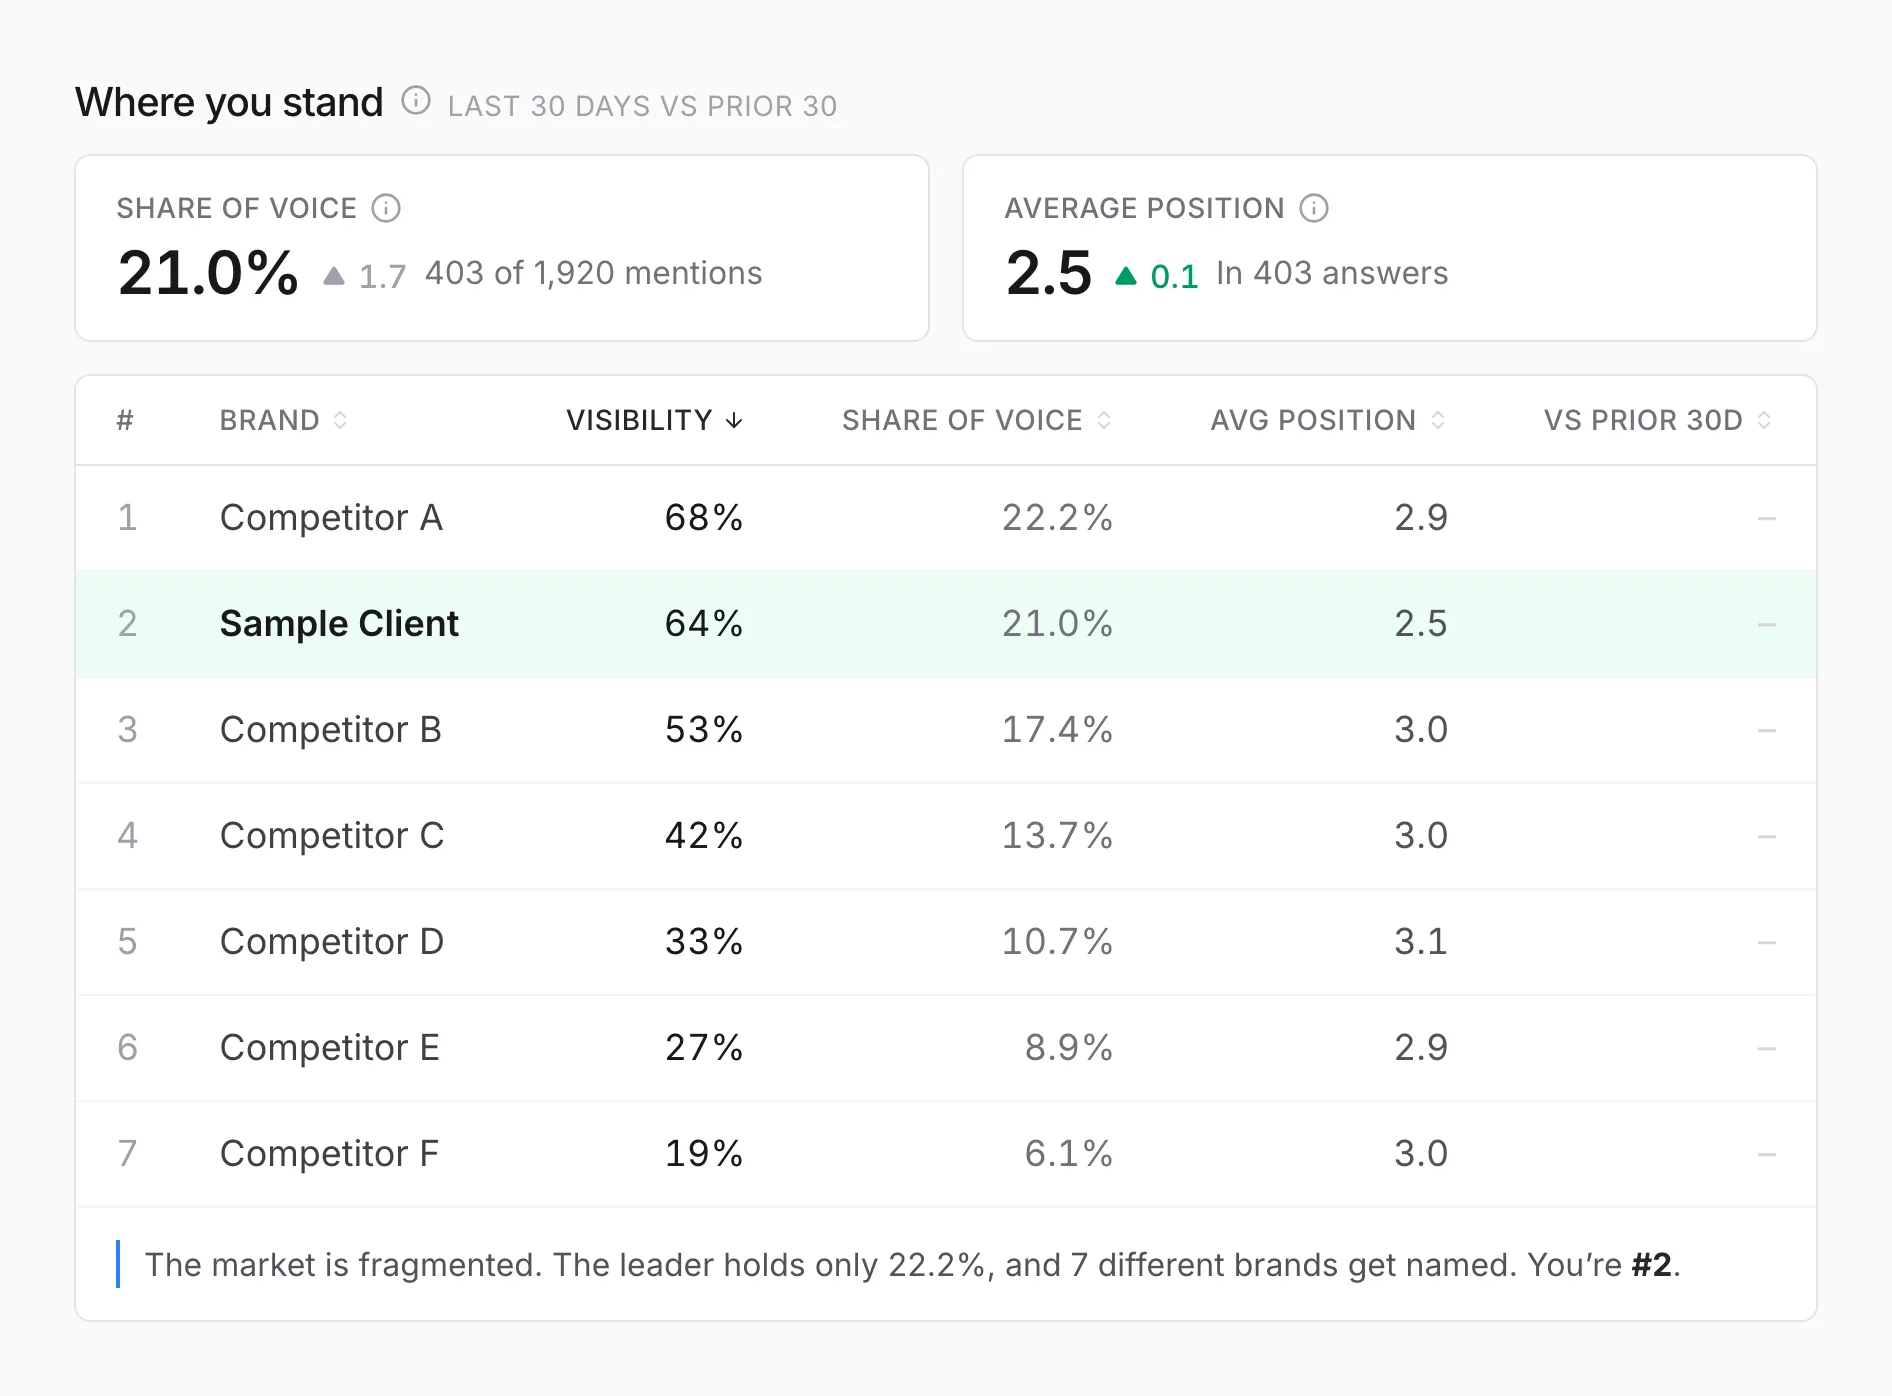
- Share of voice is your mentions as a share of every business mention in the answers. Every business the assistants name counts, not a list of competitors we picked, so the total includes everyone your customers hear about.
- Average position is where you appear in the answers that name you. 1 means named first.
- The table ranks every business named, with its visibility, share of voice, average position, and change from the period before.
Places card
Section titled “Places card”ChatGPT often answers a local question with a card of businesses, each with a rating and review count. This card shows how you do in it.
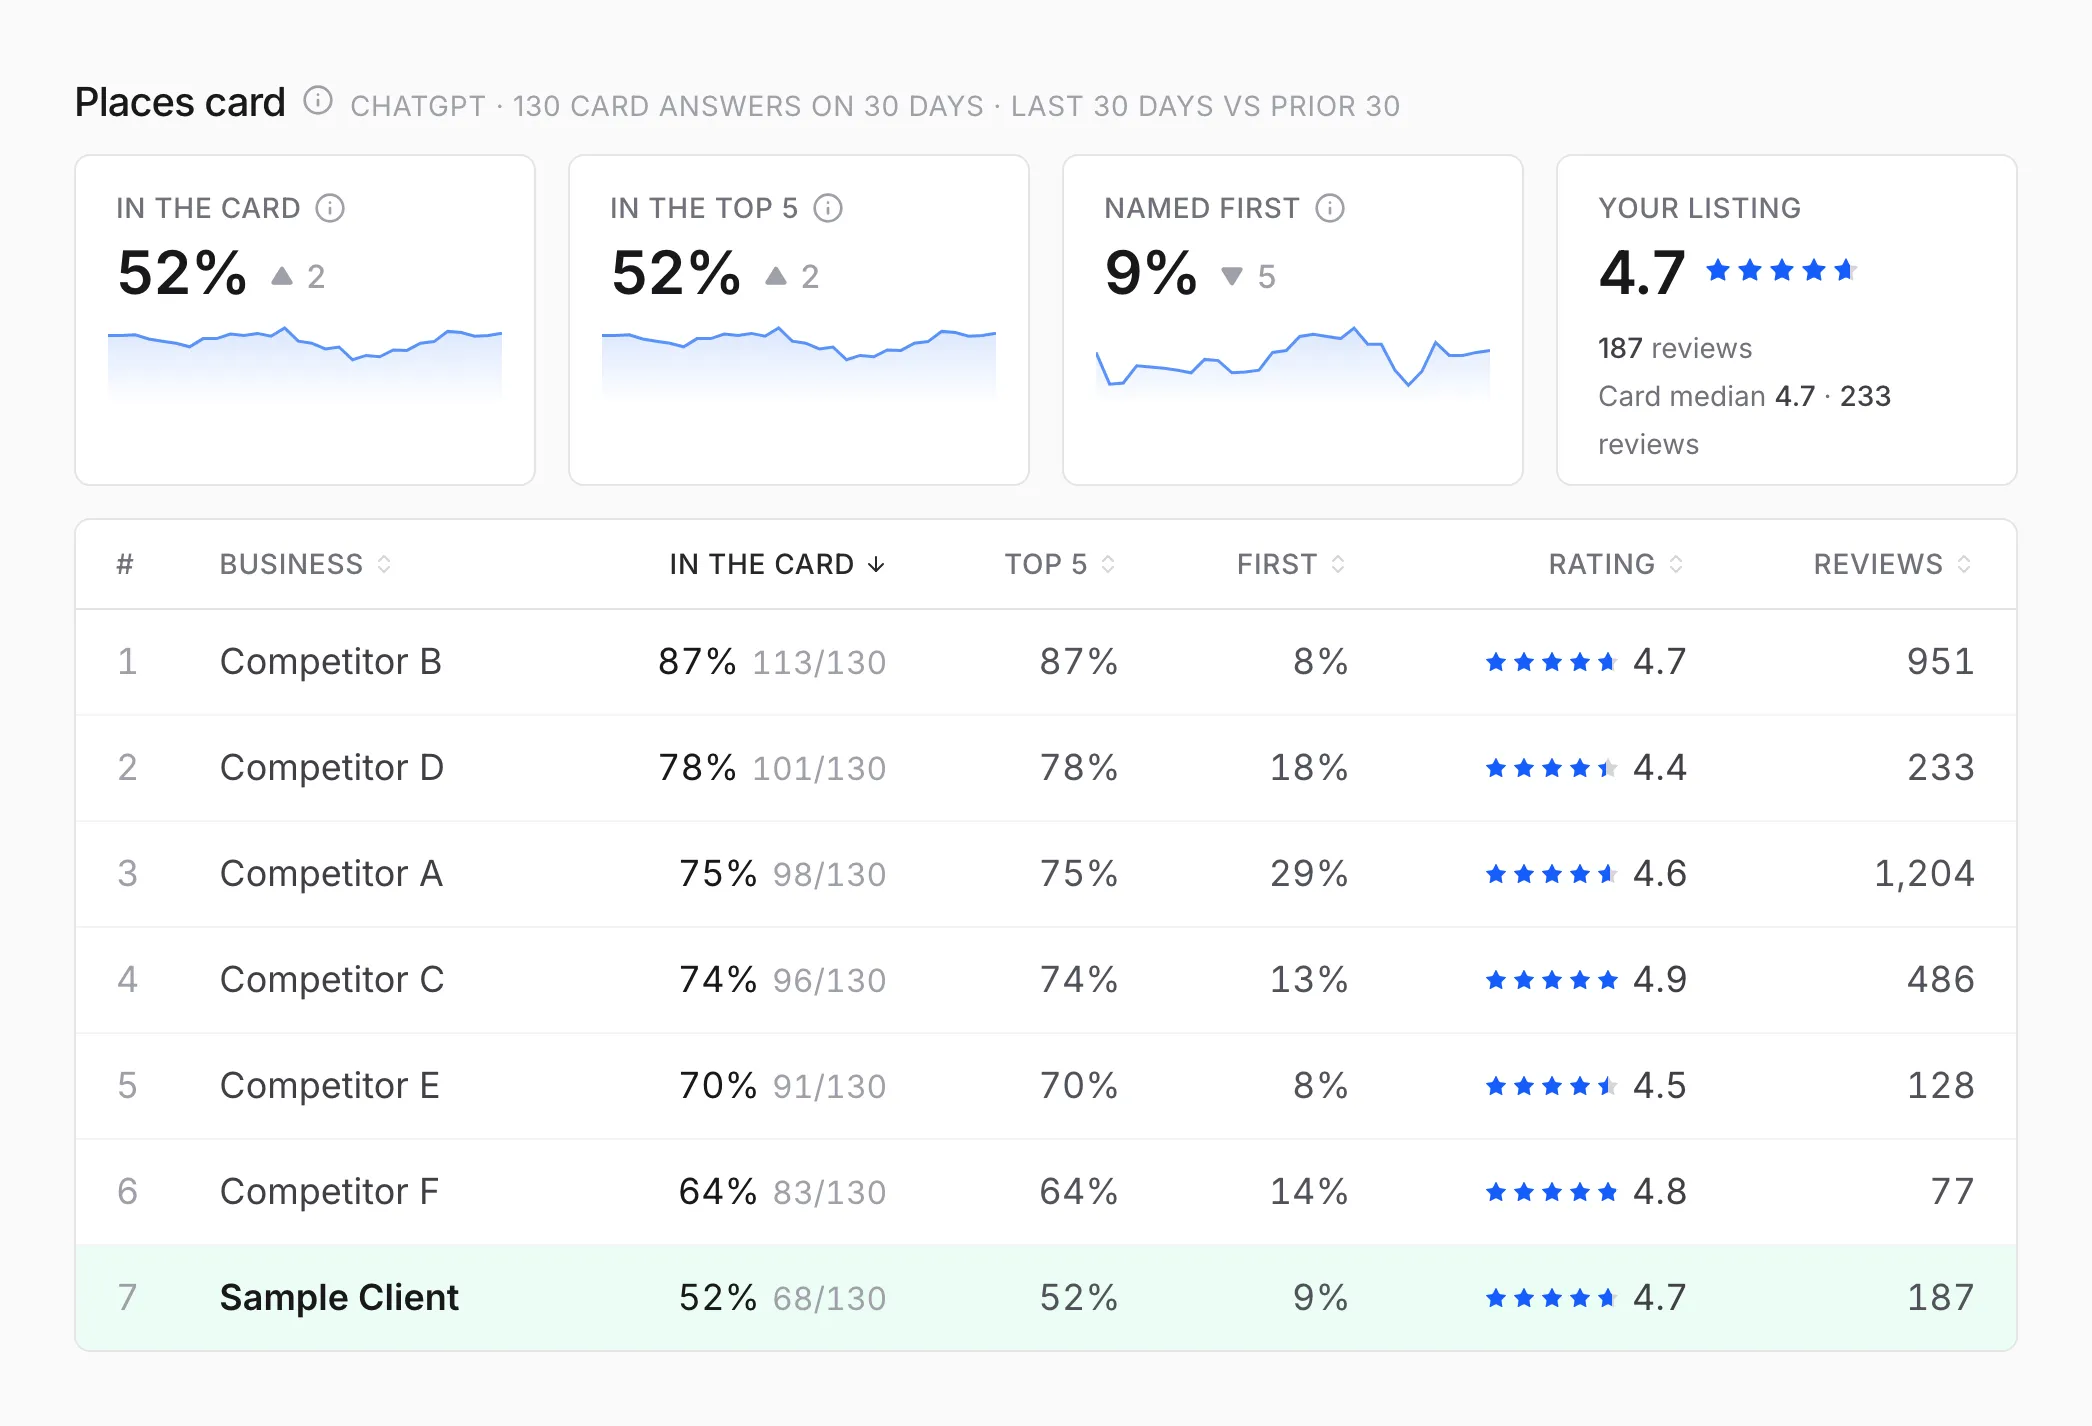
- In the card is how often your business was in the card when ChatGPT showed one.
- In the top 5 and Named first count where you sat in it.
- Your listing is your rating and review count, next to the middle rating and review count of the businesses in the card.
This section appears only when ChatGPT showed a card in the range.
AI Traffic
Section titled “AI Traffic”Real visitors that AI assistants sent to your website, from your Google Analytics. Pick a range from 7 days to 6 months.
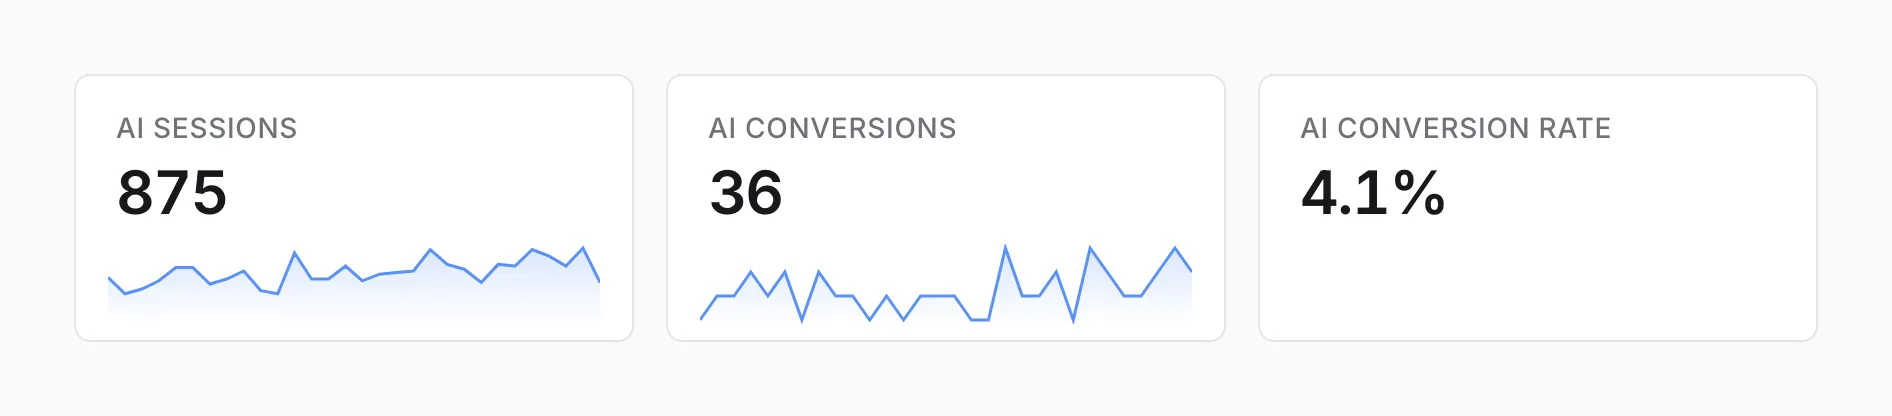
- AI sessions are visits that arrived from an AI assistant, such as someone clicking a link in a ChatGPT answer.
- AI conversions are the leads those visits sent, such as forms and calls.
- AI conversion rate is conversions divided by sessions.
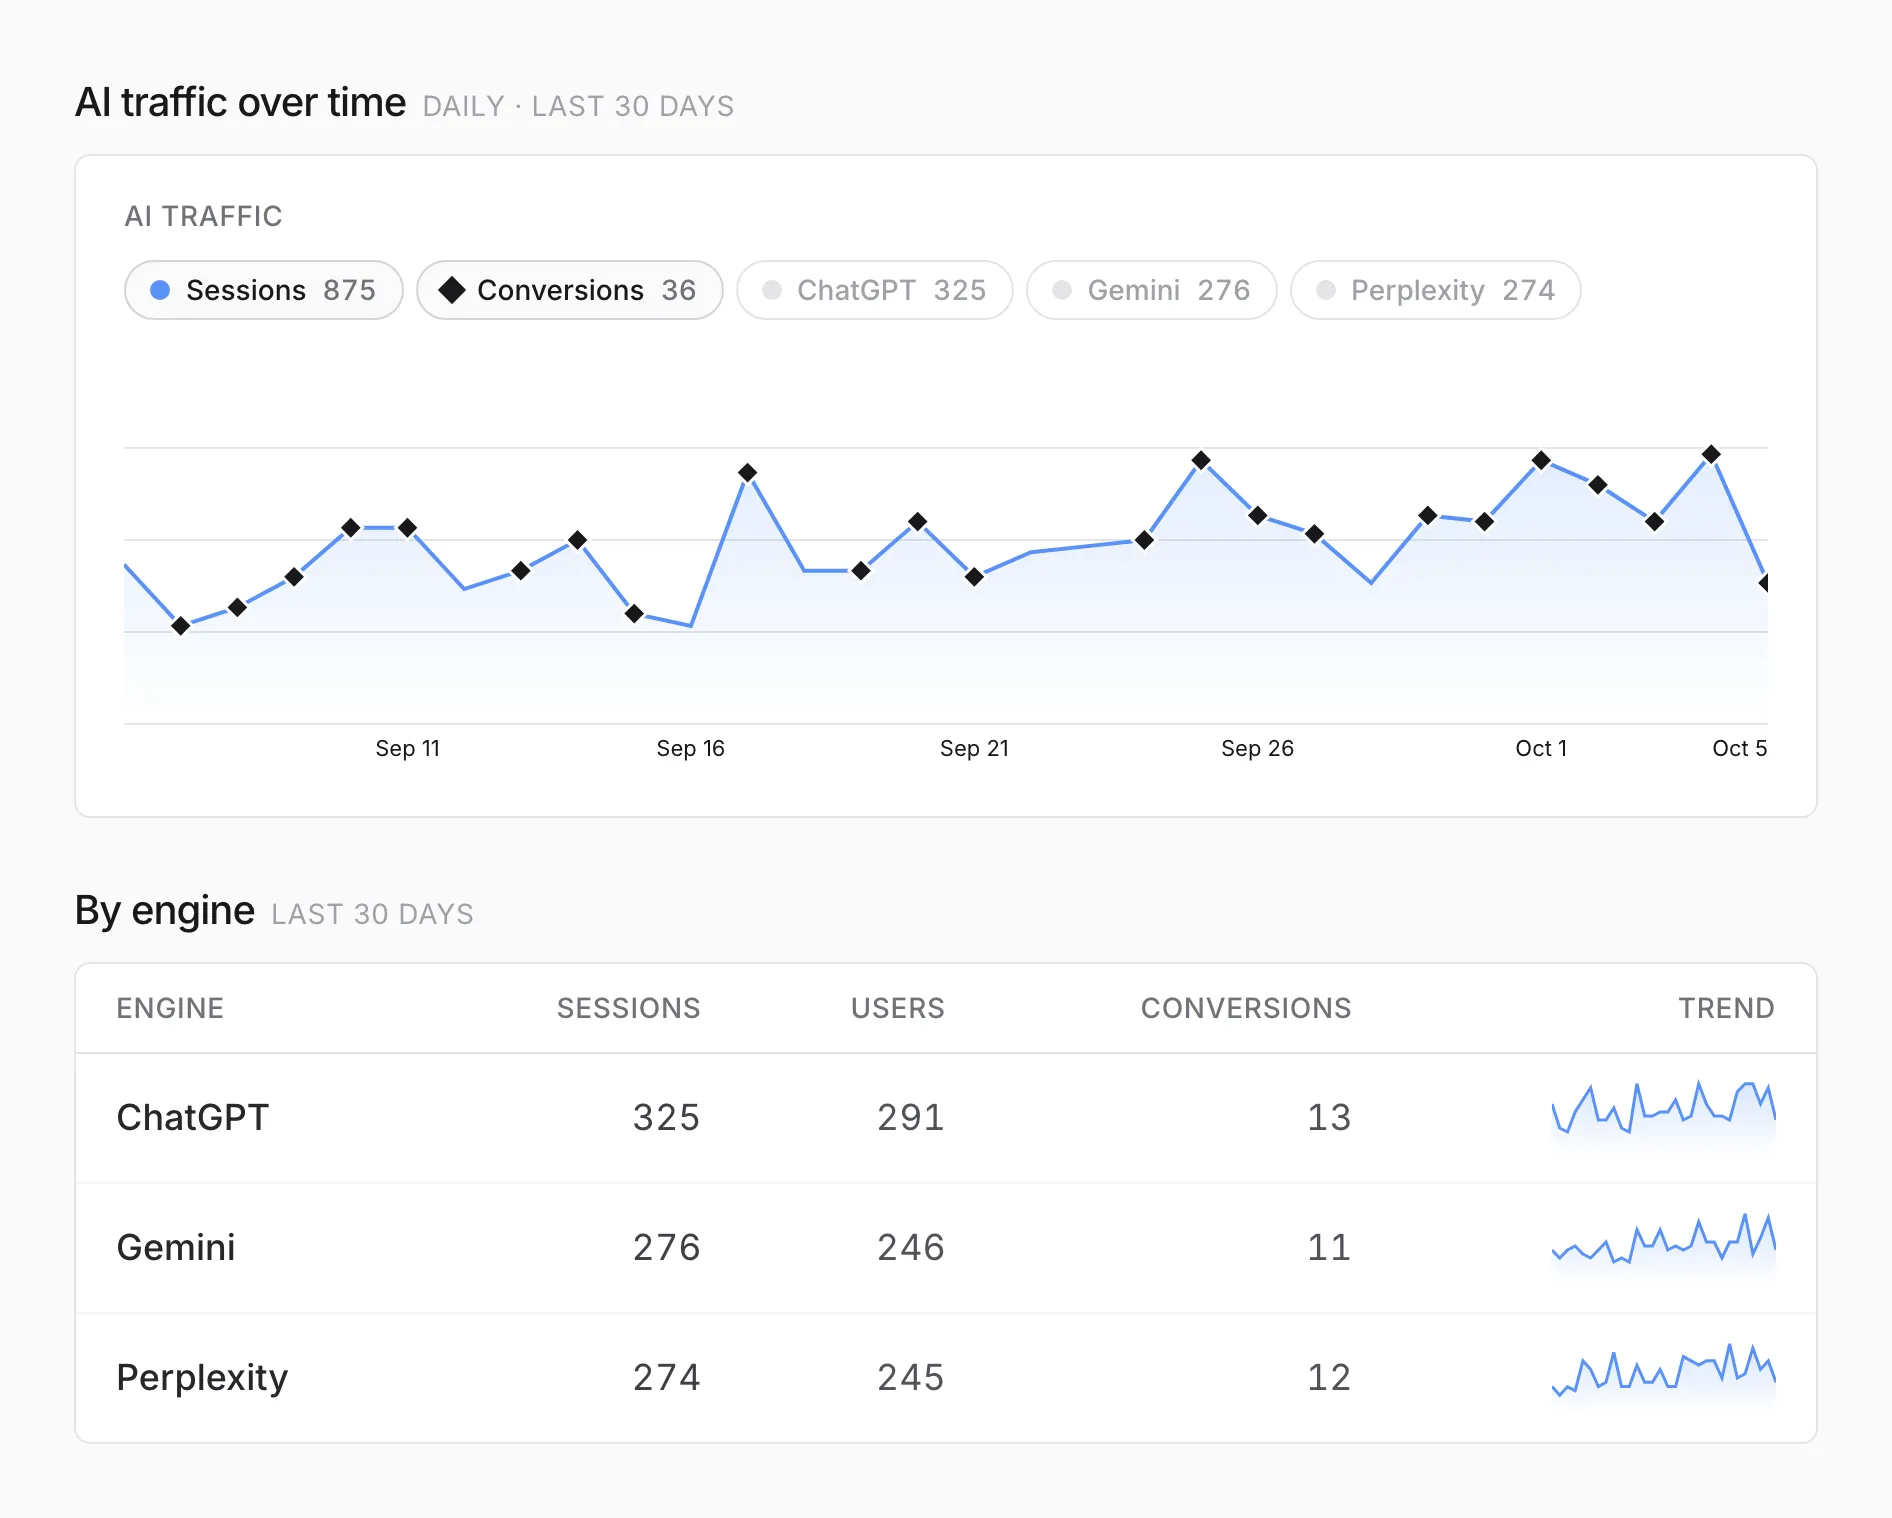
The chart shows visits over the range. Click an assistant’s name above the chart to add its line. The table under it splits the range by assistant.
How AI search works
Section titled “How AI search works”For how ChatGPT and other AI assistants find, cite, and name local businesses, and what to do about it, read How AI search works.