
Site Performance in the dashboard
Site Performance shows the technical health of your website: its score from our site audit, whether it’s up, how fast its main pages load, and what has changed on them recently. The speed numbers come from Google’s own tests.
There’s no date range to pick here. Each part shows its latest results.
Health, issues, and uptime
Section titled “Health, issues, and uptime”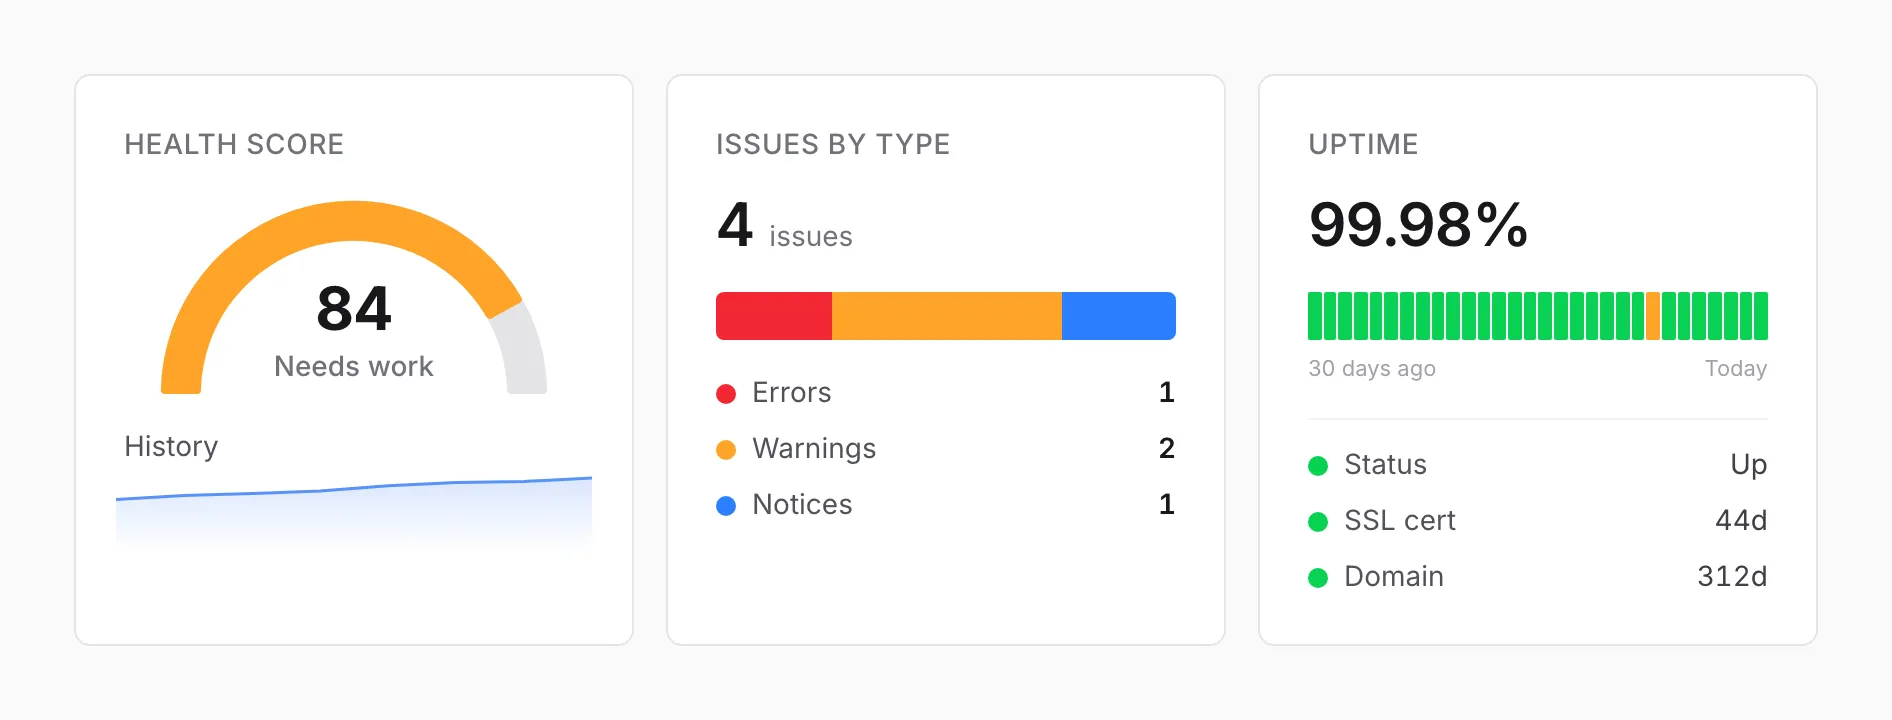
Health Score is your site’s score out of 100 from our latest site audit. 90 and up is Good, 70 to 89 is Needs work, and under 70 is Poor. The line under it shows the score at each audit, oldest to newest.
The score starts from an on-page score for the pages the audit crawled, then loses points for problems such as:
- Core Web Vitals that aren’t good for real visitors
- A home page that scores under 90 in Google’s speed test
- A sitemap that’s missing or doesn’t match the pages on the site
- Leftover placeholder text or links to a development site
- Structured data that’s missing or broken, or a broken 404 page
- Content that only appears after JavaScript runs
- A site with three pages or fewer
Issues by Type counts the kinds of problems the latest audit found, split into errors, warnings, and notices. A kind of problem counts once, whether it affects one page or many. The Notices row shows only when there are notices, and the bar turns all green when the audit found nothing. What the audit checks lists them.
Uptime comes from checking that your site responds, which we do every 5 minutes.
- The percentage is the share of checks over the last 30 days that found the site up.
- The bars are the last 30 days, one per day. Green means no downtime, amber means 99% or more, and red means less than 99%. Hover over a bar for that day’s uptime and roughly how long the site was down.
- Status is Up or Down. It changes to Down only after three failed checks in a row, about 10 minutes, so a brief blip doesn’t flip it.
- SSL cert is the number of days until your site’s security certificate expires. It turns amber 14 days out and red once it has expired.
- Domain is the number of days until your domain registration expires. It turns amber 30 days out.
If we don’t monitor your site’s uptime, the card reads “No uptime monitor.”
Core Web Vitals
Section titled “Core Web Vitals”Every Monday, we run Google’s PageSpeed Insights test on a fixed set of your key pages, including your home page. Contact pages are left out, because a page with a form is slower by nature. The set stays the same from week to week, so each week compares with the last.
The date next to the heading is the day of the latest test. Every number in this section comes from that test, so a change made since then shows up the following week.
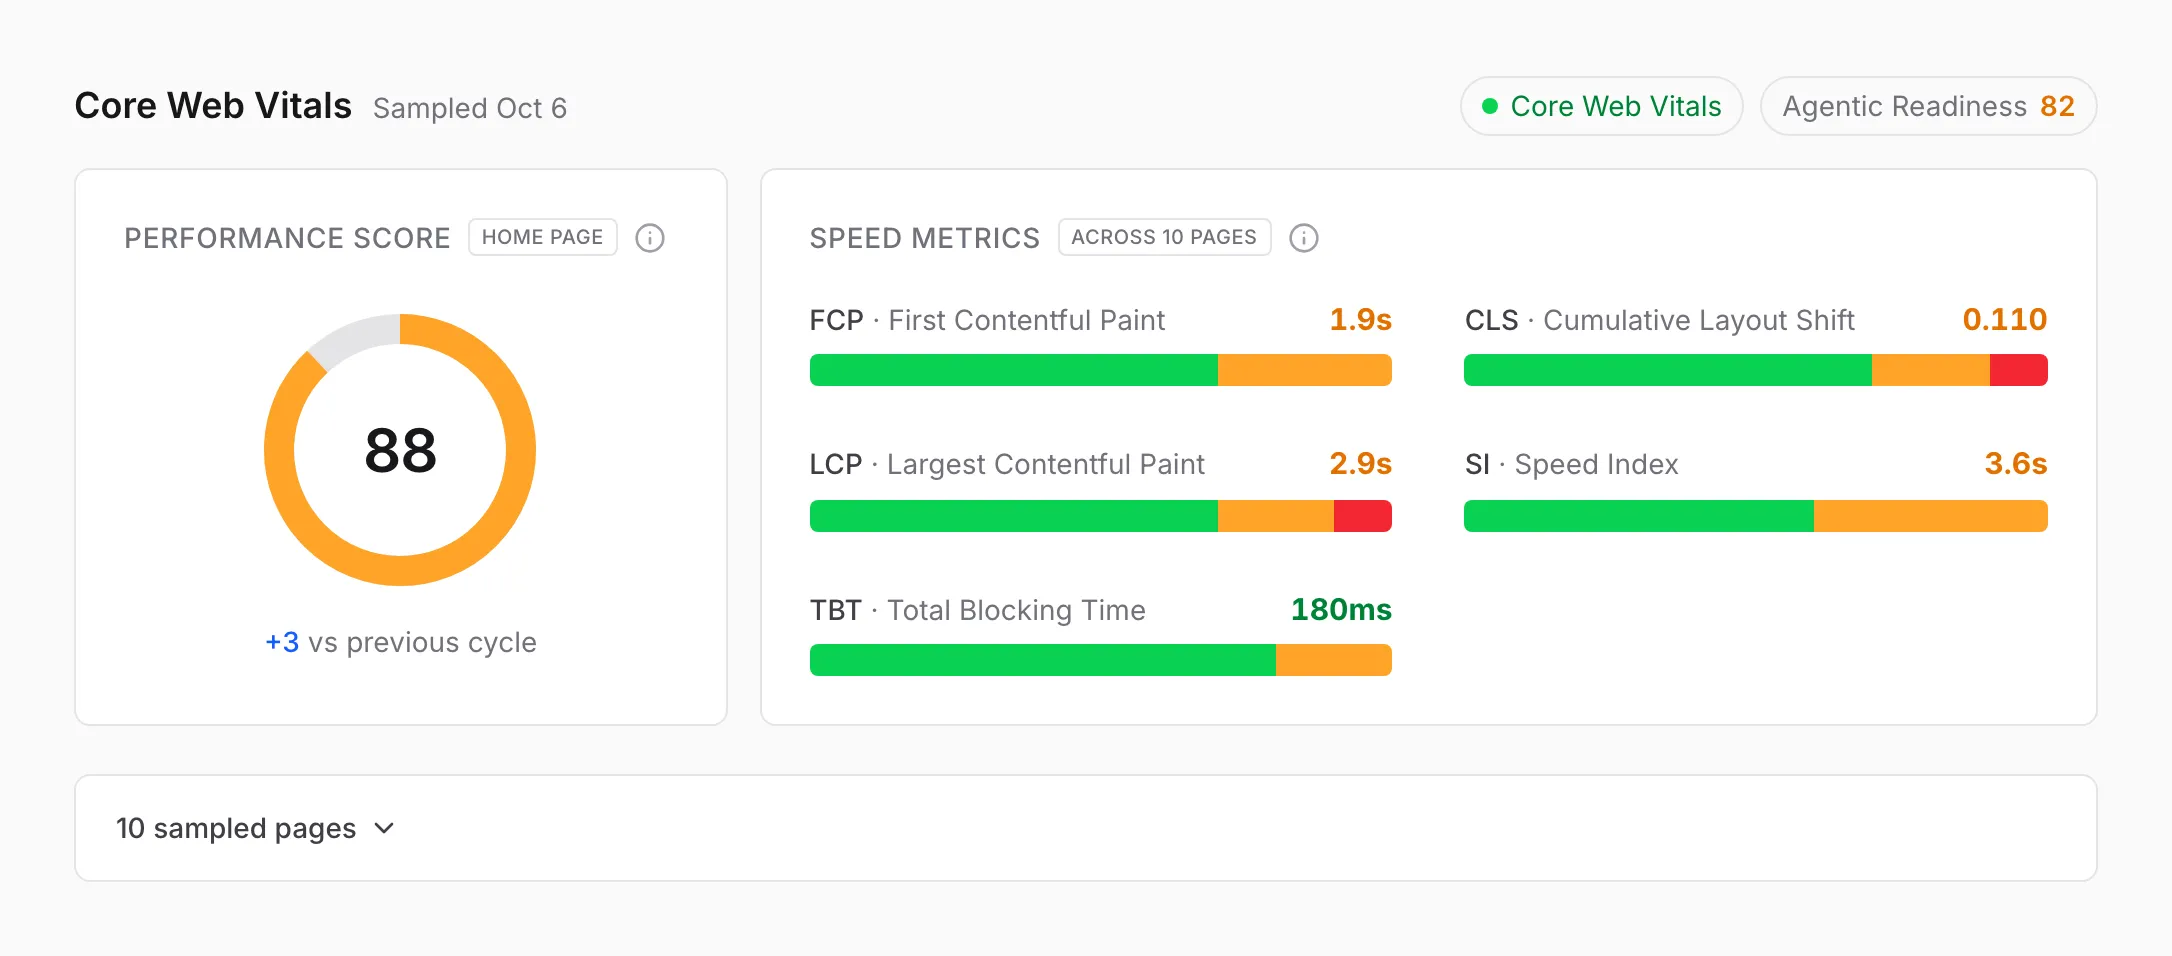
- The Core Web Vitals badge is Google’s own pass or fail for your whole site, from real Chrome visitors over the last 28 days. Green is passing, red is not passing, and gray means Google doesn’t have enough real-user data for your site.
- Agentic Readiness is Lighthouse’s agentic browsing score, averaged across the sampled pages, out of 100. Google scores it as the share of its agentic browsing checks a page passes. The checks look at how well AI agents can use a page, such as whether its buttons and links have names an agent can read. Google calls this category experimental.
- Performance Score is your home page’s Lighthouse performance score, out of 100, from the mobile test. Google’s bands are 90 and up good, 50 to 89 needs improvement, and under 50 poor. Under it is the change from the week before. If some pages couldn’t be tested that week, a line says how many were tested.
- Speed Metrics are five measurements from the same tests, across all the sampled pages. Each value is the 75th percentile, so three quarters of the pages were at that value or better. The bar splits the pages into good, needs work, and poor. Hover over the value for the threshold, or over the bar for the number of pages in each.
Each of the five measures one part of how a page loads.
- FCP, First Contentful Paint, is when the first text or image appears.
- LCP, Largest Contentful Paint, is when the largest image or block of text appears.
- TBT, Total Blocking Time, is how long the page is too busy to respond to a tap or click while it loads.
- CLS, Cumulative Layout Shift, is how much the content jumps around as it loads.
- SI, Speed Index, is how quickly the page fills in on screen.
The dashboard colors each one with these thresholds, which match Google’s own:
| Metric | Good | Needs work | Poor |
|---|---|---|---|
| FCP | 1.8s or less | 1.8s to 3s | Over 3s |
| LCP | 2.5s or less | 2.5s to 4s | Over 4s |
| TBT | 200ms or less | 200ms to 600ms | Over 600ms |
| CLS | 0.1 or less | 0.1 to 0.25 | Over 0.25 |
| SI | 3.4s or less | 3.4s to 5.8s | Over 5.8s |
These are the five metrics Lighthouse weighs to make the performance score.
Sampled pages
Section titled “Sampled pages”Click the sampled pages bar under the cards to open the page-by-page results.
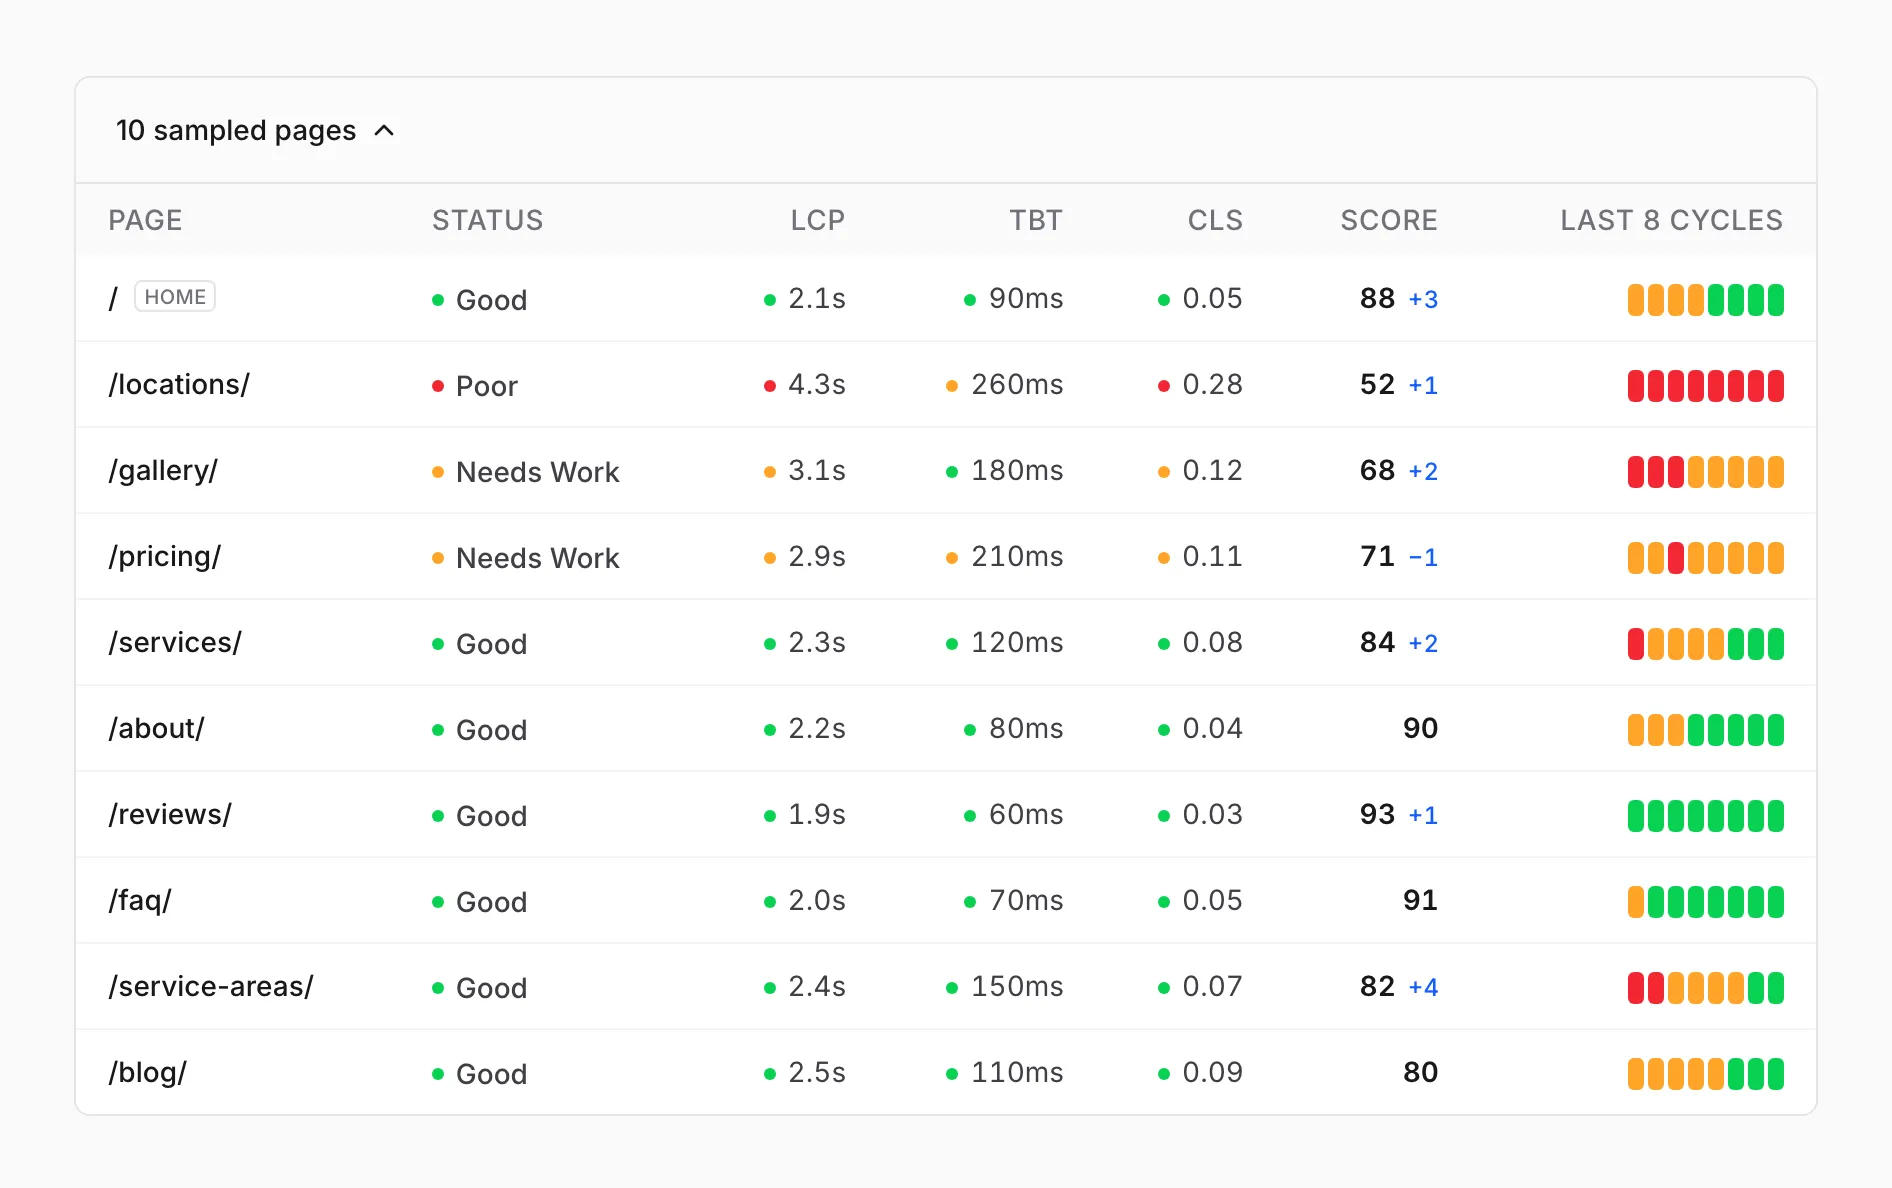
- Status is the worst of the page’s LCP, TBT, and CLS results: Good, Needs Work, or Poor. It reads n/a when the test failed for that page.
- LCP, TBT, and CLS are the page’s own values, each with a dot in the color of its result.
- Score is the page’s Lighthouse performance score, with the change from the week before.
- The strip has one block per weekly test, oldest on the left, for up to the last 12 weeks. Hover over it for the dates.
The home page is always first, and the rest are listed worst first.
Real-user experience
Section titled “Real-user experience”Google’s real-user data for your whole site, as it stood at our latest audit. It appears only when Google has enough data for your site.
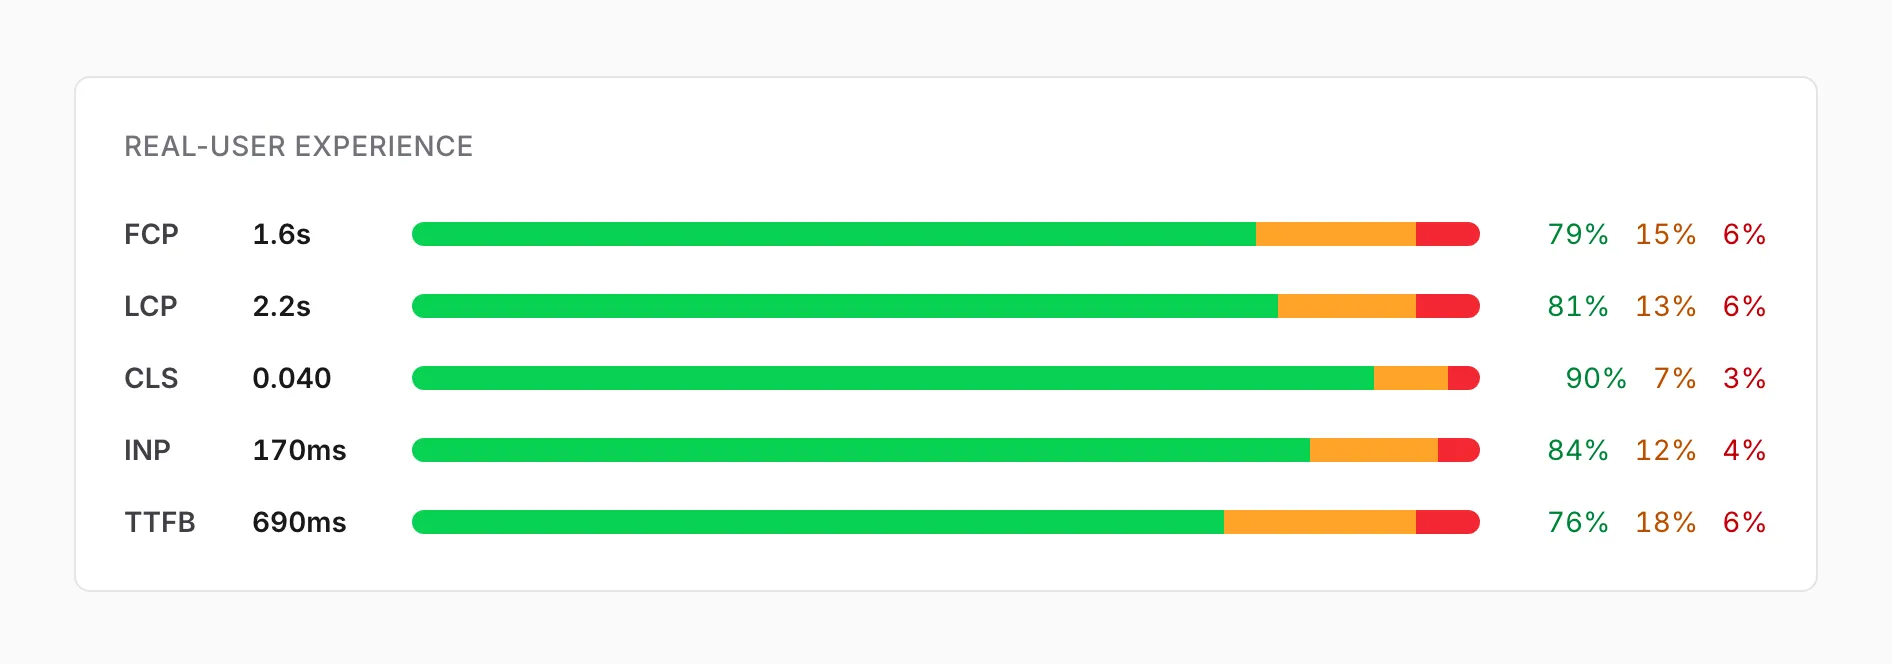
Each row shows the 75th percentile value, and the bar and percentages split page loads into good, needs improvement, and poor. INP, Interaction to Next Paint, appears only in this card, because measuring it takes real people tapping and clicking. TTFB, Time to First Byte, is how long the server takes to start sending the page. It isn’t a Core Web Vital, and Google’s guidance is 0.8s or less.
The Core Web Vitals badge reads the same kind of data, but it refreshes every week and this card with each audit, so the two can briefly disagree.
Site changes
Section titled “Site changes”Every day, we check your key pages and your site’s robots.txt file, sitemap, and HTTPS setup, and list anything that changed in the last 30 days, no matter who made the change.
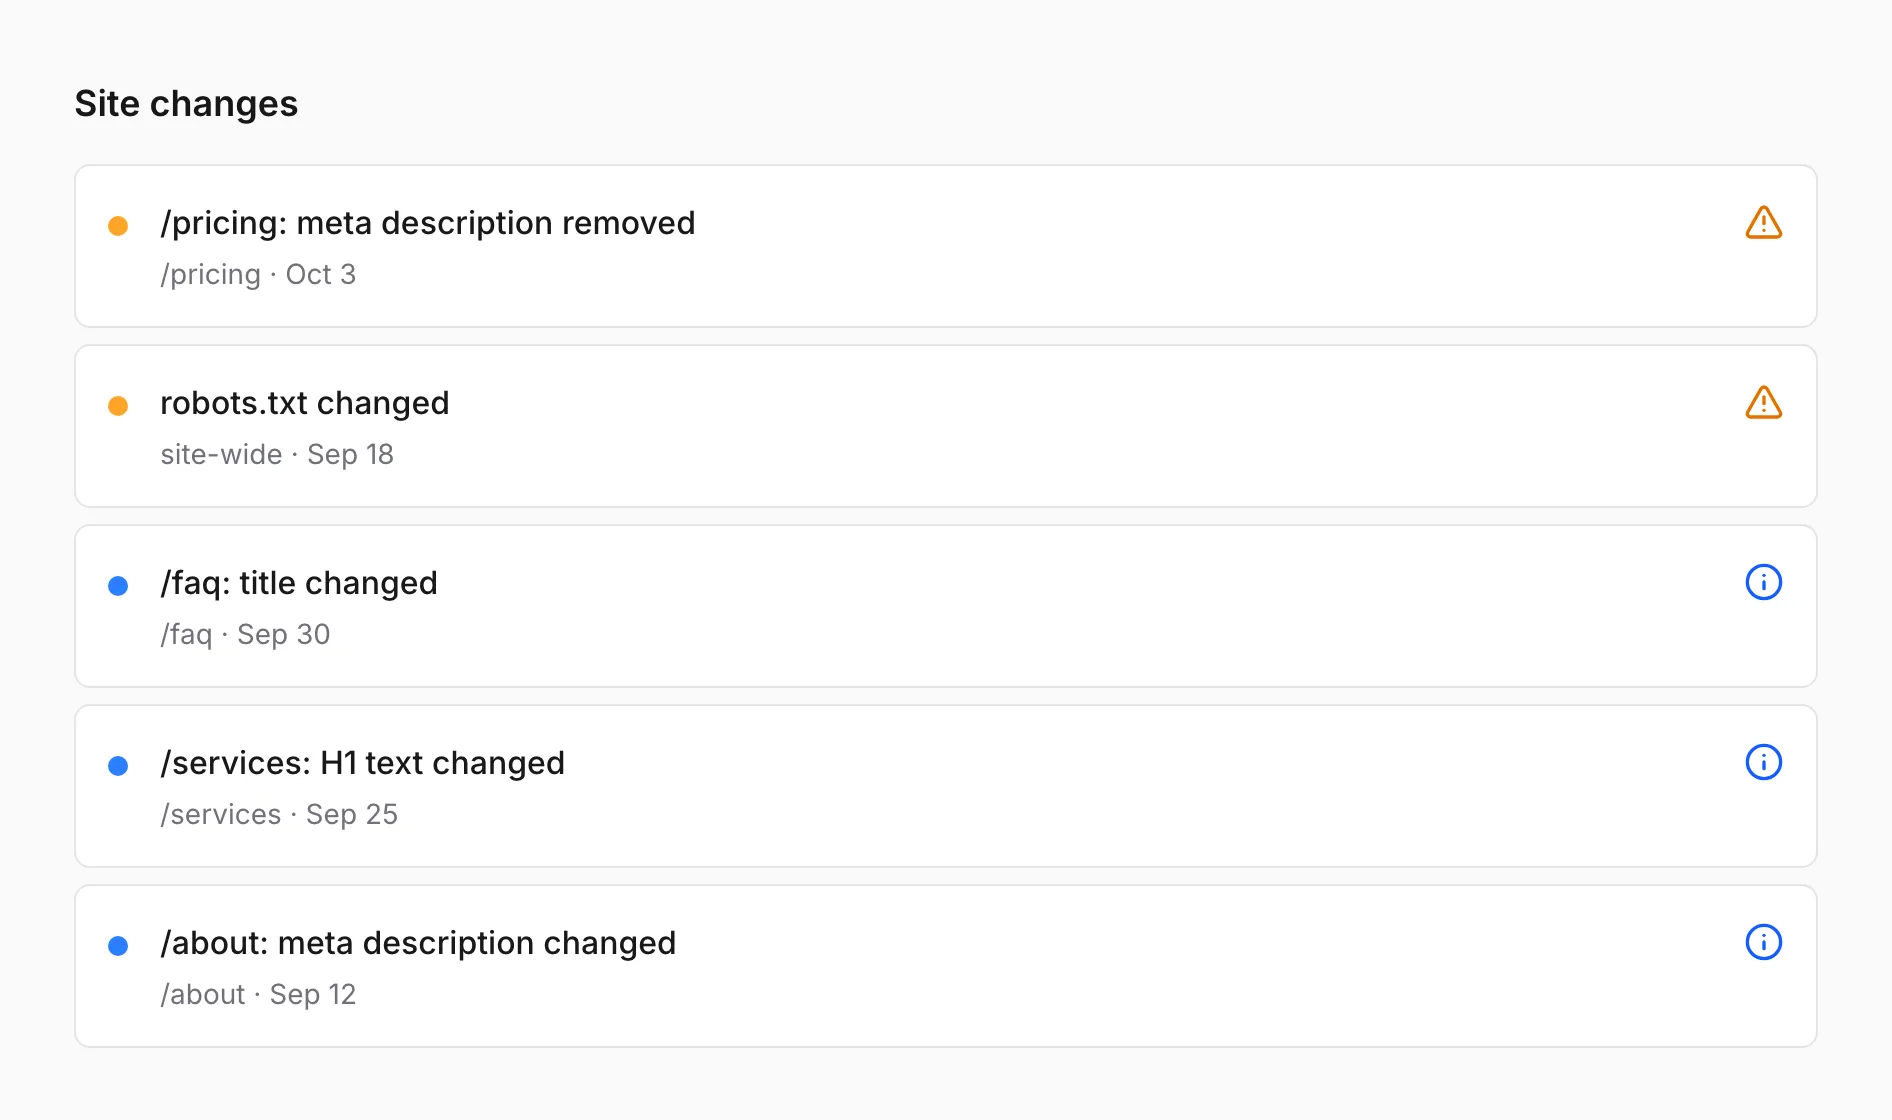
Each row shows what changed, the page (or “site-wide”), and the date. The most serious come first, up to 12 rows, with a count of any more.
| Severity | Examples |
|---|---|
| Critical (red) | A key page set to noindex, returning an error, unreachable, or redirecting elsewhere. A canonical tag pointing to another domain. Robots.txt blocking Google from the whole site. The sitemap breaking or losing half its pages. HTTP no longer redirecting to HTTPS. The home page switching between www and non-www |
| Watch (amber) | A title, meta description, H1, or canonical tag removed. Structured data removed or broken. Extra H1s or title tags on a page. A page losing 40% or more of its words or half its internal links. The same title or H1 on several pages. A change to robots.txt. Fixes show here too, such as a page that’s reachable again |
| Info (blue) | A title, meta description, or H1 changed or added. A change in the types of structured data. A canonical tag moved to another page on your site |
A key page that’s set to noindex, returns an error, or can’t be reached stays at the top as critical until it’s fixed, with the date we last checked it. When nothing has changed in 30 days, a green row says so, with the number of pages we watch.
Initial Audit
Section titled “Initial Audit”If our first audit of your site came before we started work on it, Initial Audit appears under Site Performance in the sidebar. It’s this page as it was at that first audit, with the date and the number of pages crawled at the top. It shows the Health Score, Issues by Type, and real-user data from that audit, and the Core Web Vitals section from your first weekly speed test. The Uptime card is today’s, and Site changes isn’t part of it.
Open it next to the live page to compare where the site started with where it is now.
What the audit checks
Section titled “What the audit checks”Our site audit crawls your website and checks each page it finds. Issues by Type counts what it finds by severity. The dashboard shows the counts, not the list of issues.
| Type | Means |
|---|---|
| Error | A problem to fix |
| Warning | A recommendation to weigh for your site |
| Notice | For your information |
Unless marked, each check below is an error.
- Crawling and indexing. A sitemap and a robots.txt file. Pages in the sitemap that nothing on the site links to, and pages missing from the sitemap (warnings). Robots.txt rules that block AI answer engines (warning). Redirect loops. Whether an address that doesn’t exist returns a real 404 status, and whether the 404 page links back to the site. Folders that list their files to anyone. A server that doesn’t support HTTP/2. Addresses mixed with and without a trailing slash (warning). The insecure www version of your address taking two redirects to land (notice).
- Titles, descriptions, and headings. Pages without a title, a meta description, or a main heading (H1). Pages with more than one H1. Titles and descriptions shared by several pages. Titles under 20 or over 120 characters (warnings). Titles over 70 characters, which search results cut off (notice).
- Content. Pages that read as near copies of each other. A site with three pages or fewer. Dummy filler text, and links or files pointing to a staging or development site. Unfinished template text, such as a to-do note left in the copy (warning). Content that only appears after JavaScript runs, which AI assistants and link previews can’t read.
- Links and images. Broken links. Broken images, scripts, and stylesheets. Jump links to a spot on a page that doesn’t exist. Secure pages linking to insecure http:// addresses. Images without alt text.
- Structured data. No structured data on the site (warning). Markup that doesn’t parse. Types or properties that don’t exist in the schema.org vocabulary. Missing fields Google requires for rich results. No LocalBusiness entity on a local business’s site (warning).
- The scan itself. Pages that couldn’t be loaded during the audit (notice).
How Core Web Vitals work
Section titled “How Core Web Vitals work”Core Web Vitals are three measures Google uses to judge what a page is like to use:
- LCP, Largest Contentful Paint, measures loading. It’s when the largest image or block of text appears.
- INP, Interaction to Next Paint, measures responsiveness. It’s how quickly the page reacts to taps, clicks, and key presses, across the whole visit.
- CLS, Cumulative Layout Shift, measures visual stability. It’s how much the content moves around unexpectedly.
Google judges each one at the 75th percentile of page loads, separately for mobile and desktop, so at least three quarters of visits need to be good.
| Metric | Good | Needs improvement | Poor |
|---|---|---|---|
| LCP | 2.5s or less | 2.5s to 4s | Over 4s |
| INP | 200ms or less | 200ms to 500ms | Over 500ms |
| CLS | 0.1 or less | 0.1 to 0.25 | Over 0.25 |
A site passes the Core Web Vitals assessment in PageSpeed Insights when all three are good. When Google doesn’t have enough INP data, LCP and CLS decide it.
Field data and lab data
Section titled “Field data and lab data”Field data comes from real visitors. Google collects it from real Chrome users whose settings allow it, in a dataset called the Chrome UX Report (CrUX), and reports the last 28 days. A site needs enough visitors to have any, and Chrome on iPhone doesn’t contribute. When a page doesn’t have enough data of its own, Google reports the whole site. Google says it uses this data in Search as part of judging page experience.
Lab data comes from Lighthouse, the test inside PageSpeed Insights. It loads a page once, on a simulated mid-range phone on a mobile network. Because the setup is the same every time, it’s good for comparing one week with the next and for catching a problem right after a change.
A lab test can’t measure INP, because nobody taps or clicks during it. Total Blocking Time, the time a page is too busy to respond while it loads, is Google’s lab stand-in. Google calls it a reasonable proxy for INP, but not a substitute.
That’s why each sampled page’s status uses lab LCP, TBT in place of INP, and CLS. The weekly test works on every page whether or not Google has field data for it, and a fix shows up the next week instead of over 28 days. The Core Web Vitals badge and the Real-user experience card are where the field data shows.
Lighthouse’s other scores
Section titled “Lighthouse’s other scores”Lighthouse also scores pages for Accessibility, Best Practices, and SEO. The dashboard shows the Performance score and the Agentic Readiness score, and doesn’t show those three.
Lighthouse’s SEO category runs basic checks that a page can be crawled and understood, such as having a meta description and a valid robots.txt file. Our site audit also checks every page it crawls for a meta description, and checks the site for a robots.txt file.
When it updates
Section titled “When it updates”| Part | Updates |
|---|---|
| Health Score, Issues by Type, Real-user experience | Each time we audit your site |
| Uptime | Every 5 minutes. The domain’s expiration date refreshes about once a week |
| Core Web Vitals | Every Monday morning, Central time |
| Site changes | Every day, early in the morning Central time |
Why this can differ from PageSpeed Insights
Section titled “Why this can differ from PageSpeed Insights”If you run PageSpeed Insights yourself, your numbers may not match the dashboard’s.
- Lab scores move from run to run, even on a page that hasn’t changed, because of things like changes in the ads being served, A/B tests, and internet routing. The dashboard shows one test a week.
- The dashboard uses the mobile test. Check the Mobile tab in PageSpeed Insights.
- Your site may have changed since Monday’s test.
- Speed Metrics cover all the sampled pages, not the one page you tested.
- Real-user data can be for one page or the whole site. PageSpeed Insights shows a page’s own data when Google has enough of it. The Core Web Vitals badge always uses your whole site’s.