
Google Analytics in the dashboard
The Google Analytics section shows what visitors do on your website: the leads they send, how many arrive from Google search, and which pages bring them in. The numbers come from your site’s Google Analytics 4 property.
It covers up to the last 6 months. Each card compares the range you pick with the same number of days just before it.
Conversions
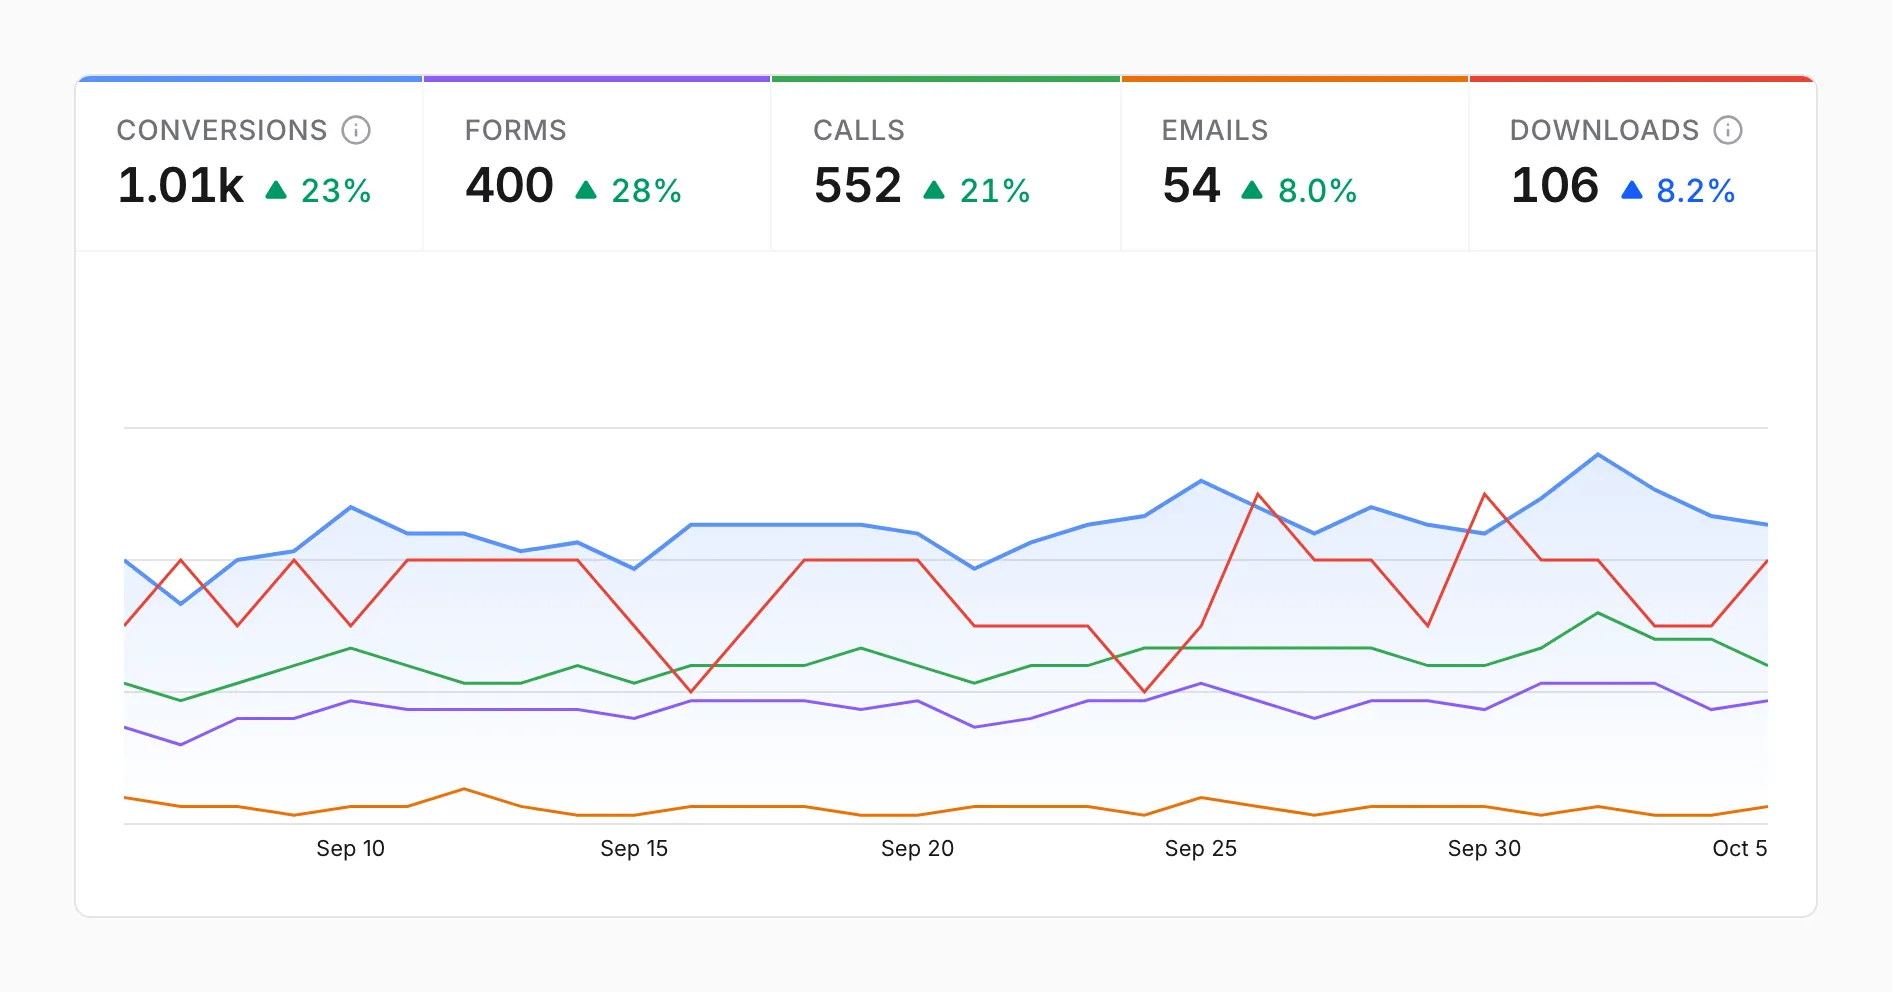
Section titled “Conversions”The top card counts the leads your website sent, by type, with a line for each over the range.
| Tile | Counts |
|---|---|
| Conversions | Forms, calls, and emails added together (and signups, where a site has them) |
| Forms | Form submissions, such as a contact or quote form |
| Calls | Taps on a phone number on your site, plus tracked calls where call tracking is set up |
| Emails | Clicks on an email address on your site |
| Downloads | Files visitors downloaded, such as a PDF report. Shown only when a site has downloads |
Downloads aren’t leads, so they’re never part of Conversions. Click a tile to show or hide its line on the chart. The chart shows each day up to 30 days and each week for longer ranges.
By channel
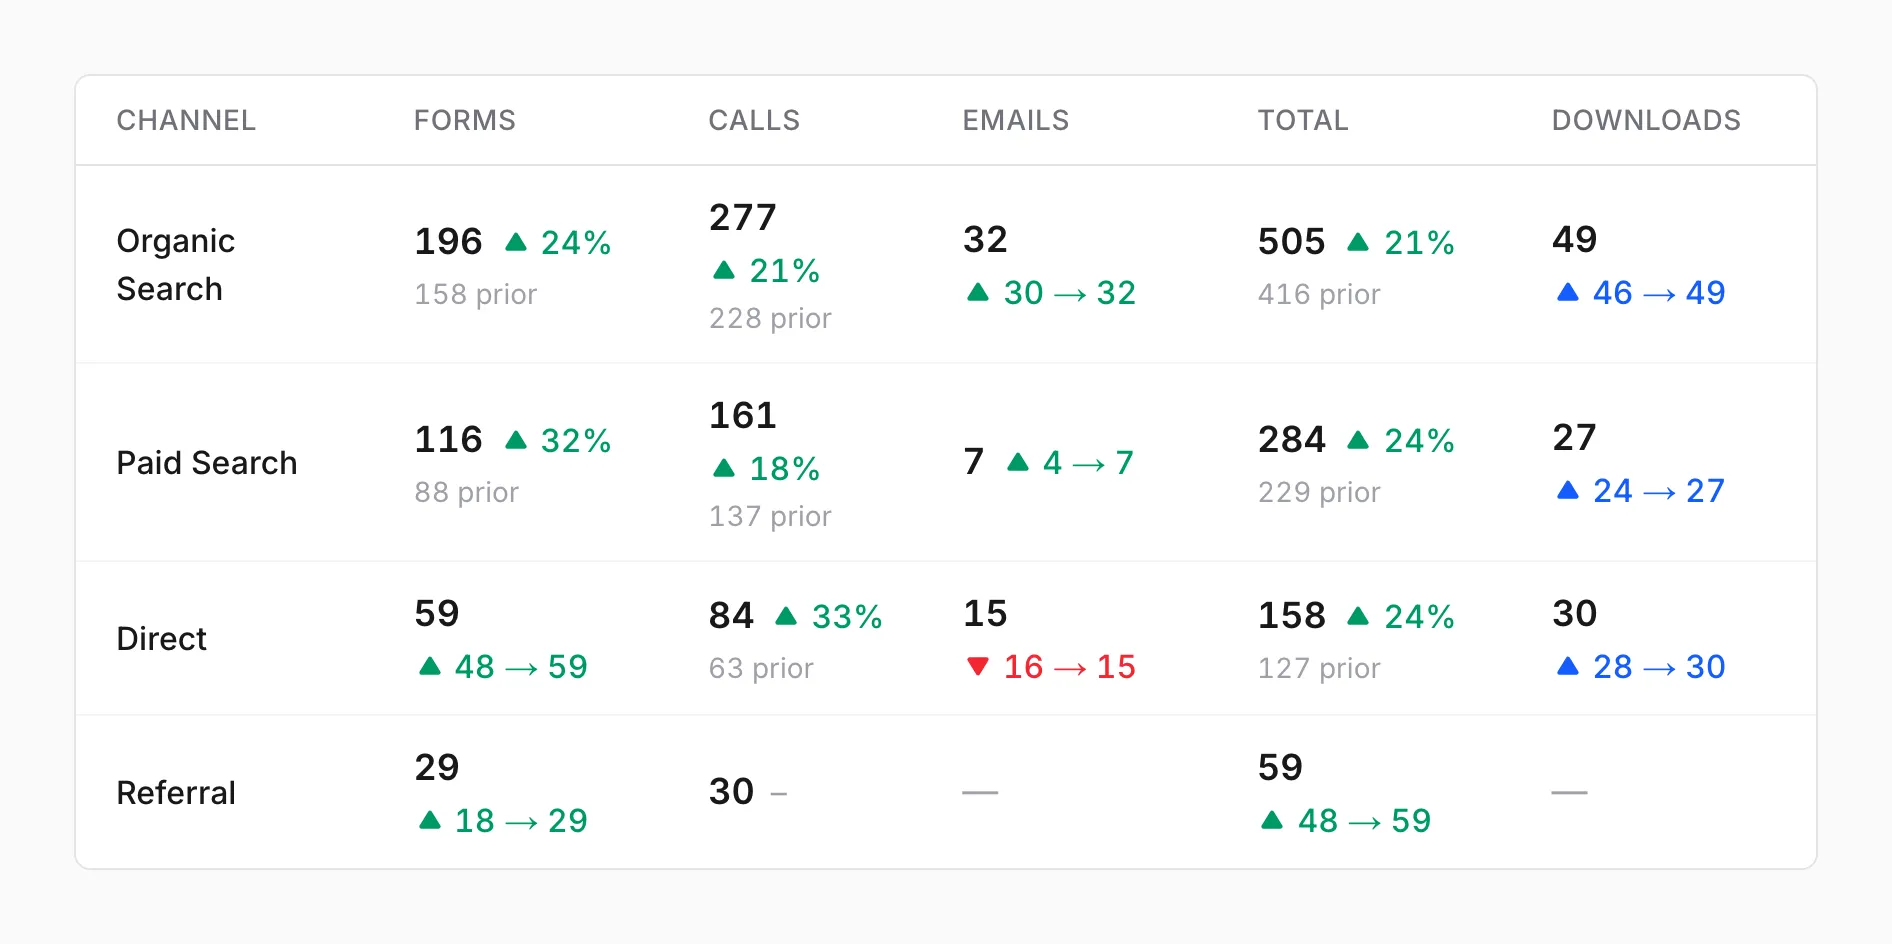
Section titled “By channel”Under the chart, the same counts are split by how the visitor arrived: Organic Search, Paid Search, Direct, Referral, and so on. When the earlier number is under 50, the change shows as “before → now” instead of a percentage, because a percentage of a small number swings too much to mean anything.
Organic search
Section titled “Organic search”Visits from unpaid search results on Google, Bing, and other search engines, with the people behind them.
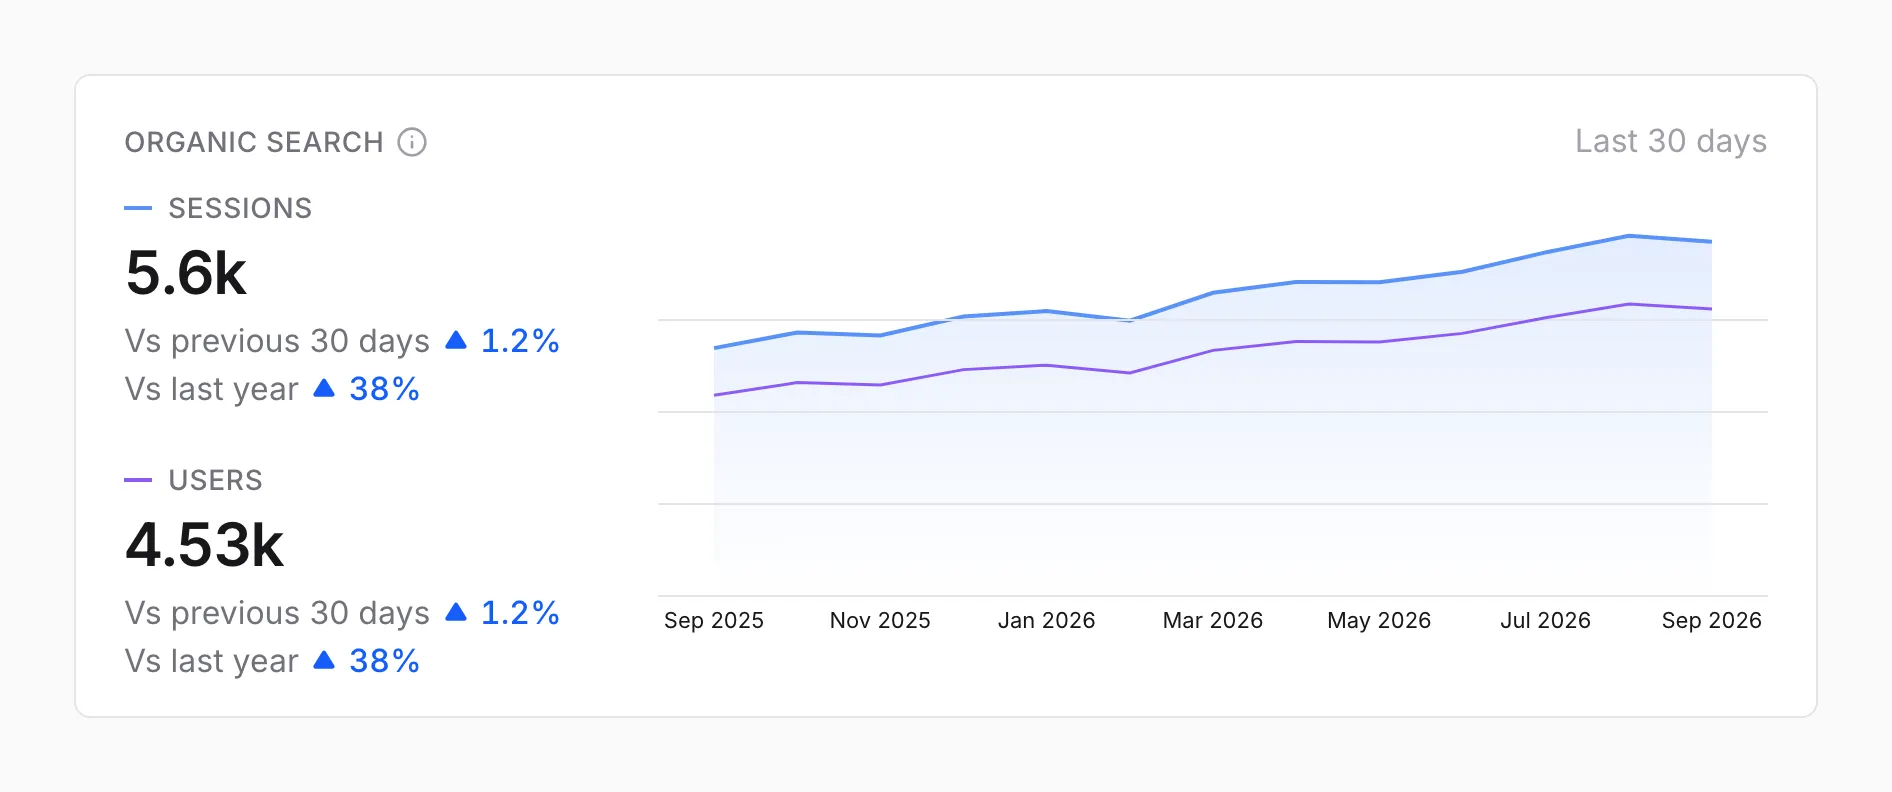
- Sessions are visits. One person can make several.
- Users are the people behind those visits, each counted once in the range.
- Vs last year compares the same dates a year earlier. It’s left out when Google Analytics has no data from a year ago.
The line shows the last 13 months, so seasonal ups and downs are easy to see.
Traffic context and engagement
Section titled “Traffic context and engagement”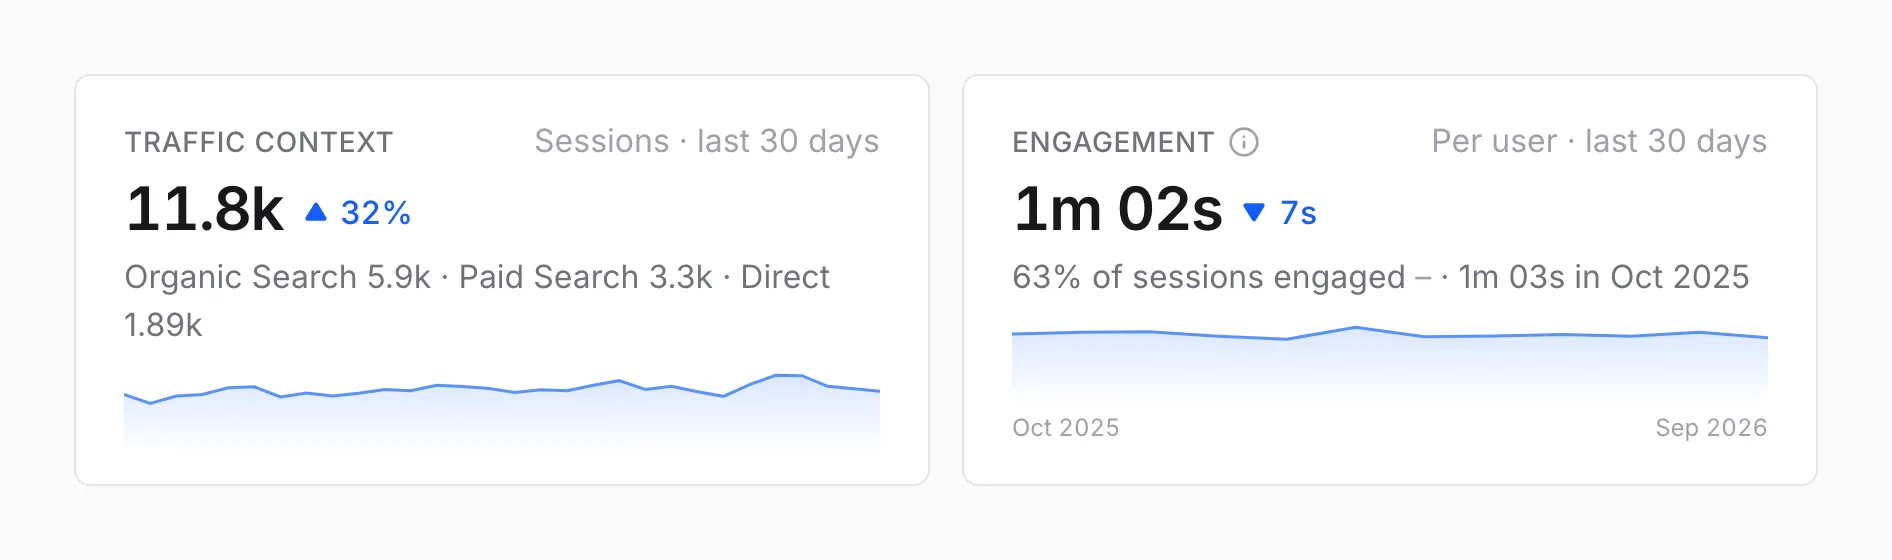
Traffic context is every visit from every channel, with the three biggest channels named. It puts the organic number in proportion.
Engagement is the average time each visitor spent on the site, and the share of visits that were engaged. Google Analytics only counts time while the page is on screen, and it calls a visit engaged when it lasted over 10 seconds, viewed 2 or more pages, or led to a conversion.
Key pages
Section titled “Key pages”The pages that matter most to your business, chosen with you and grouped the way you think about them, such as services, guides, and contact pages.
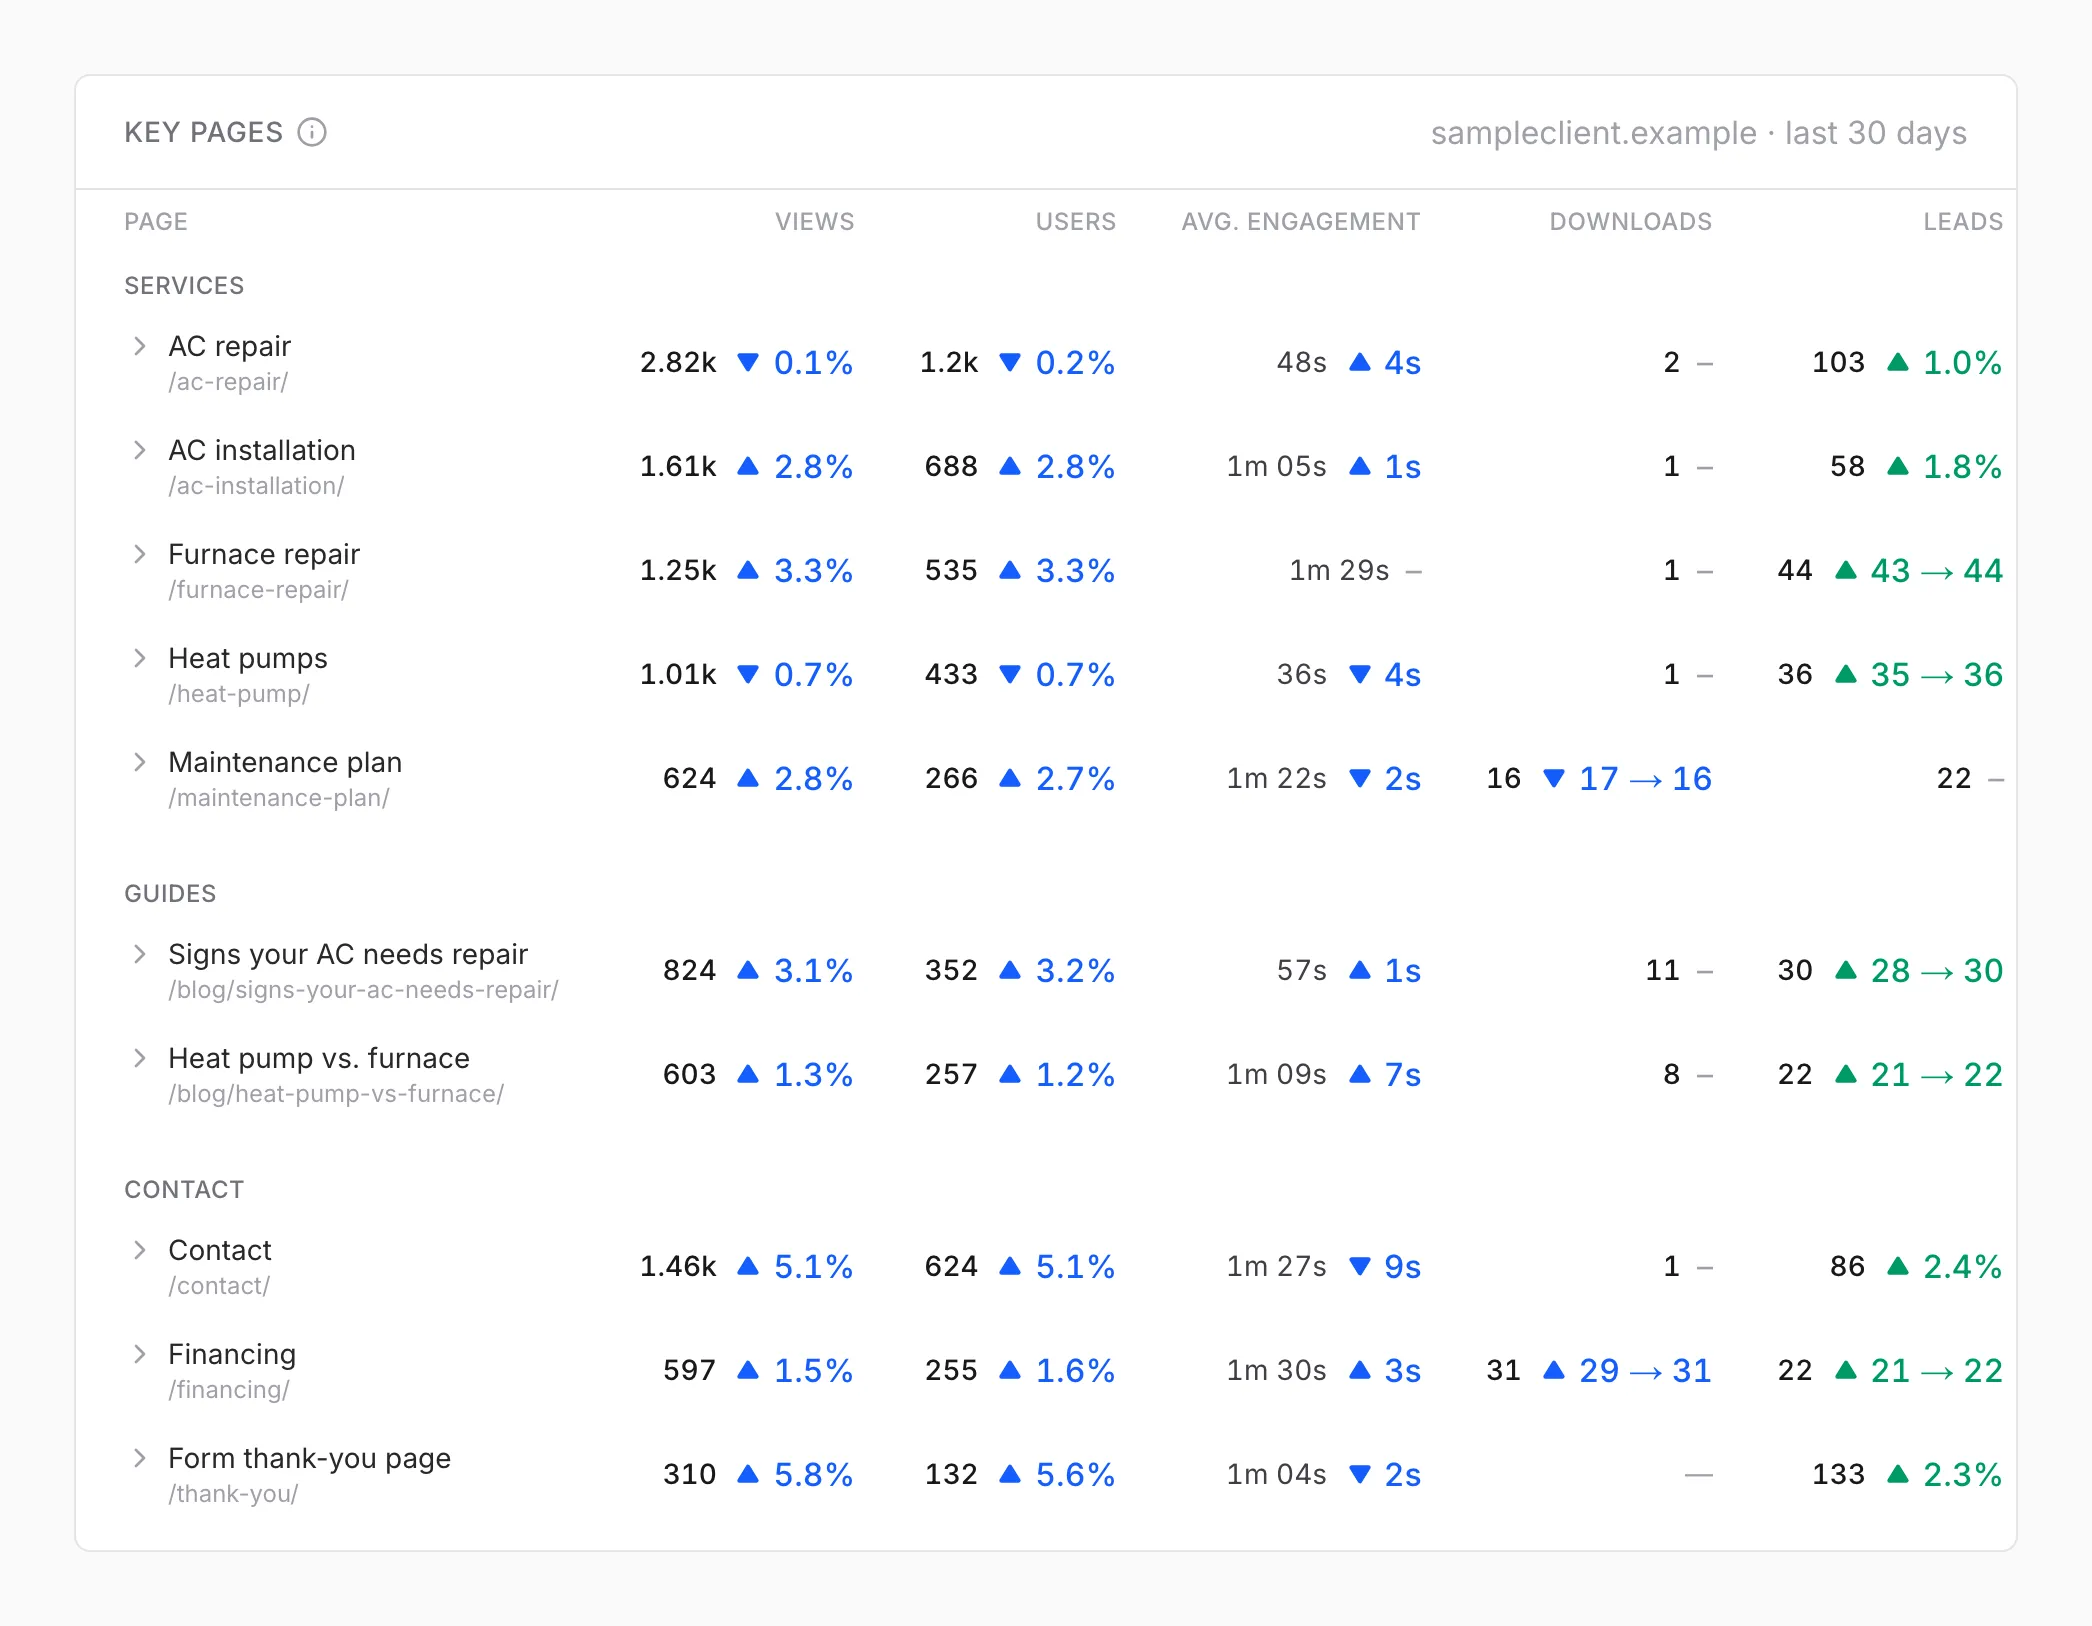
| Column | Counts |
|---|---|
| Views | Times the page was viewed |
| Users | People who viewed it |
| Avg. engagement | Average time on the page per person. The change shows once both periods have at least 20 people |
| Downloads | Files downloaded from the page |
| Leads | Forms, calls, and emails that happened on the page |
A lead counts on the page where it happened. Many forms send people to a thank-you page after they submit, and the lead is recorded there, which is why a contact page can show fewer leads than you’d expect. If your site works that way, we add the thank-you page as a key page.
We set the key pages up with you. To add or remove one, just ask.
How people got here
Section titled “How people got here”Click any key page to open it.
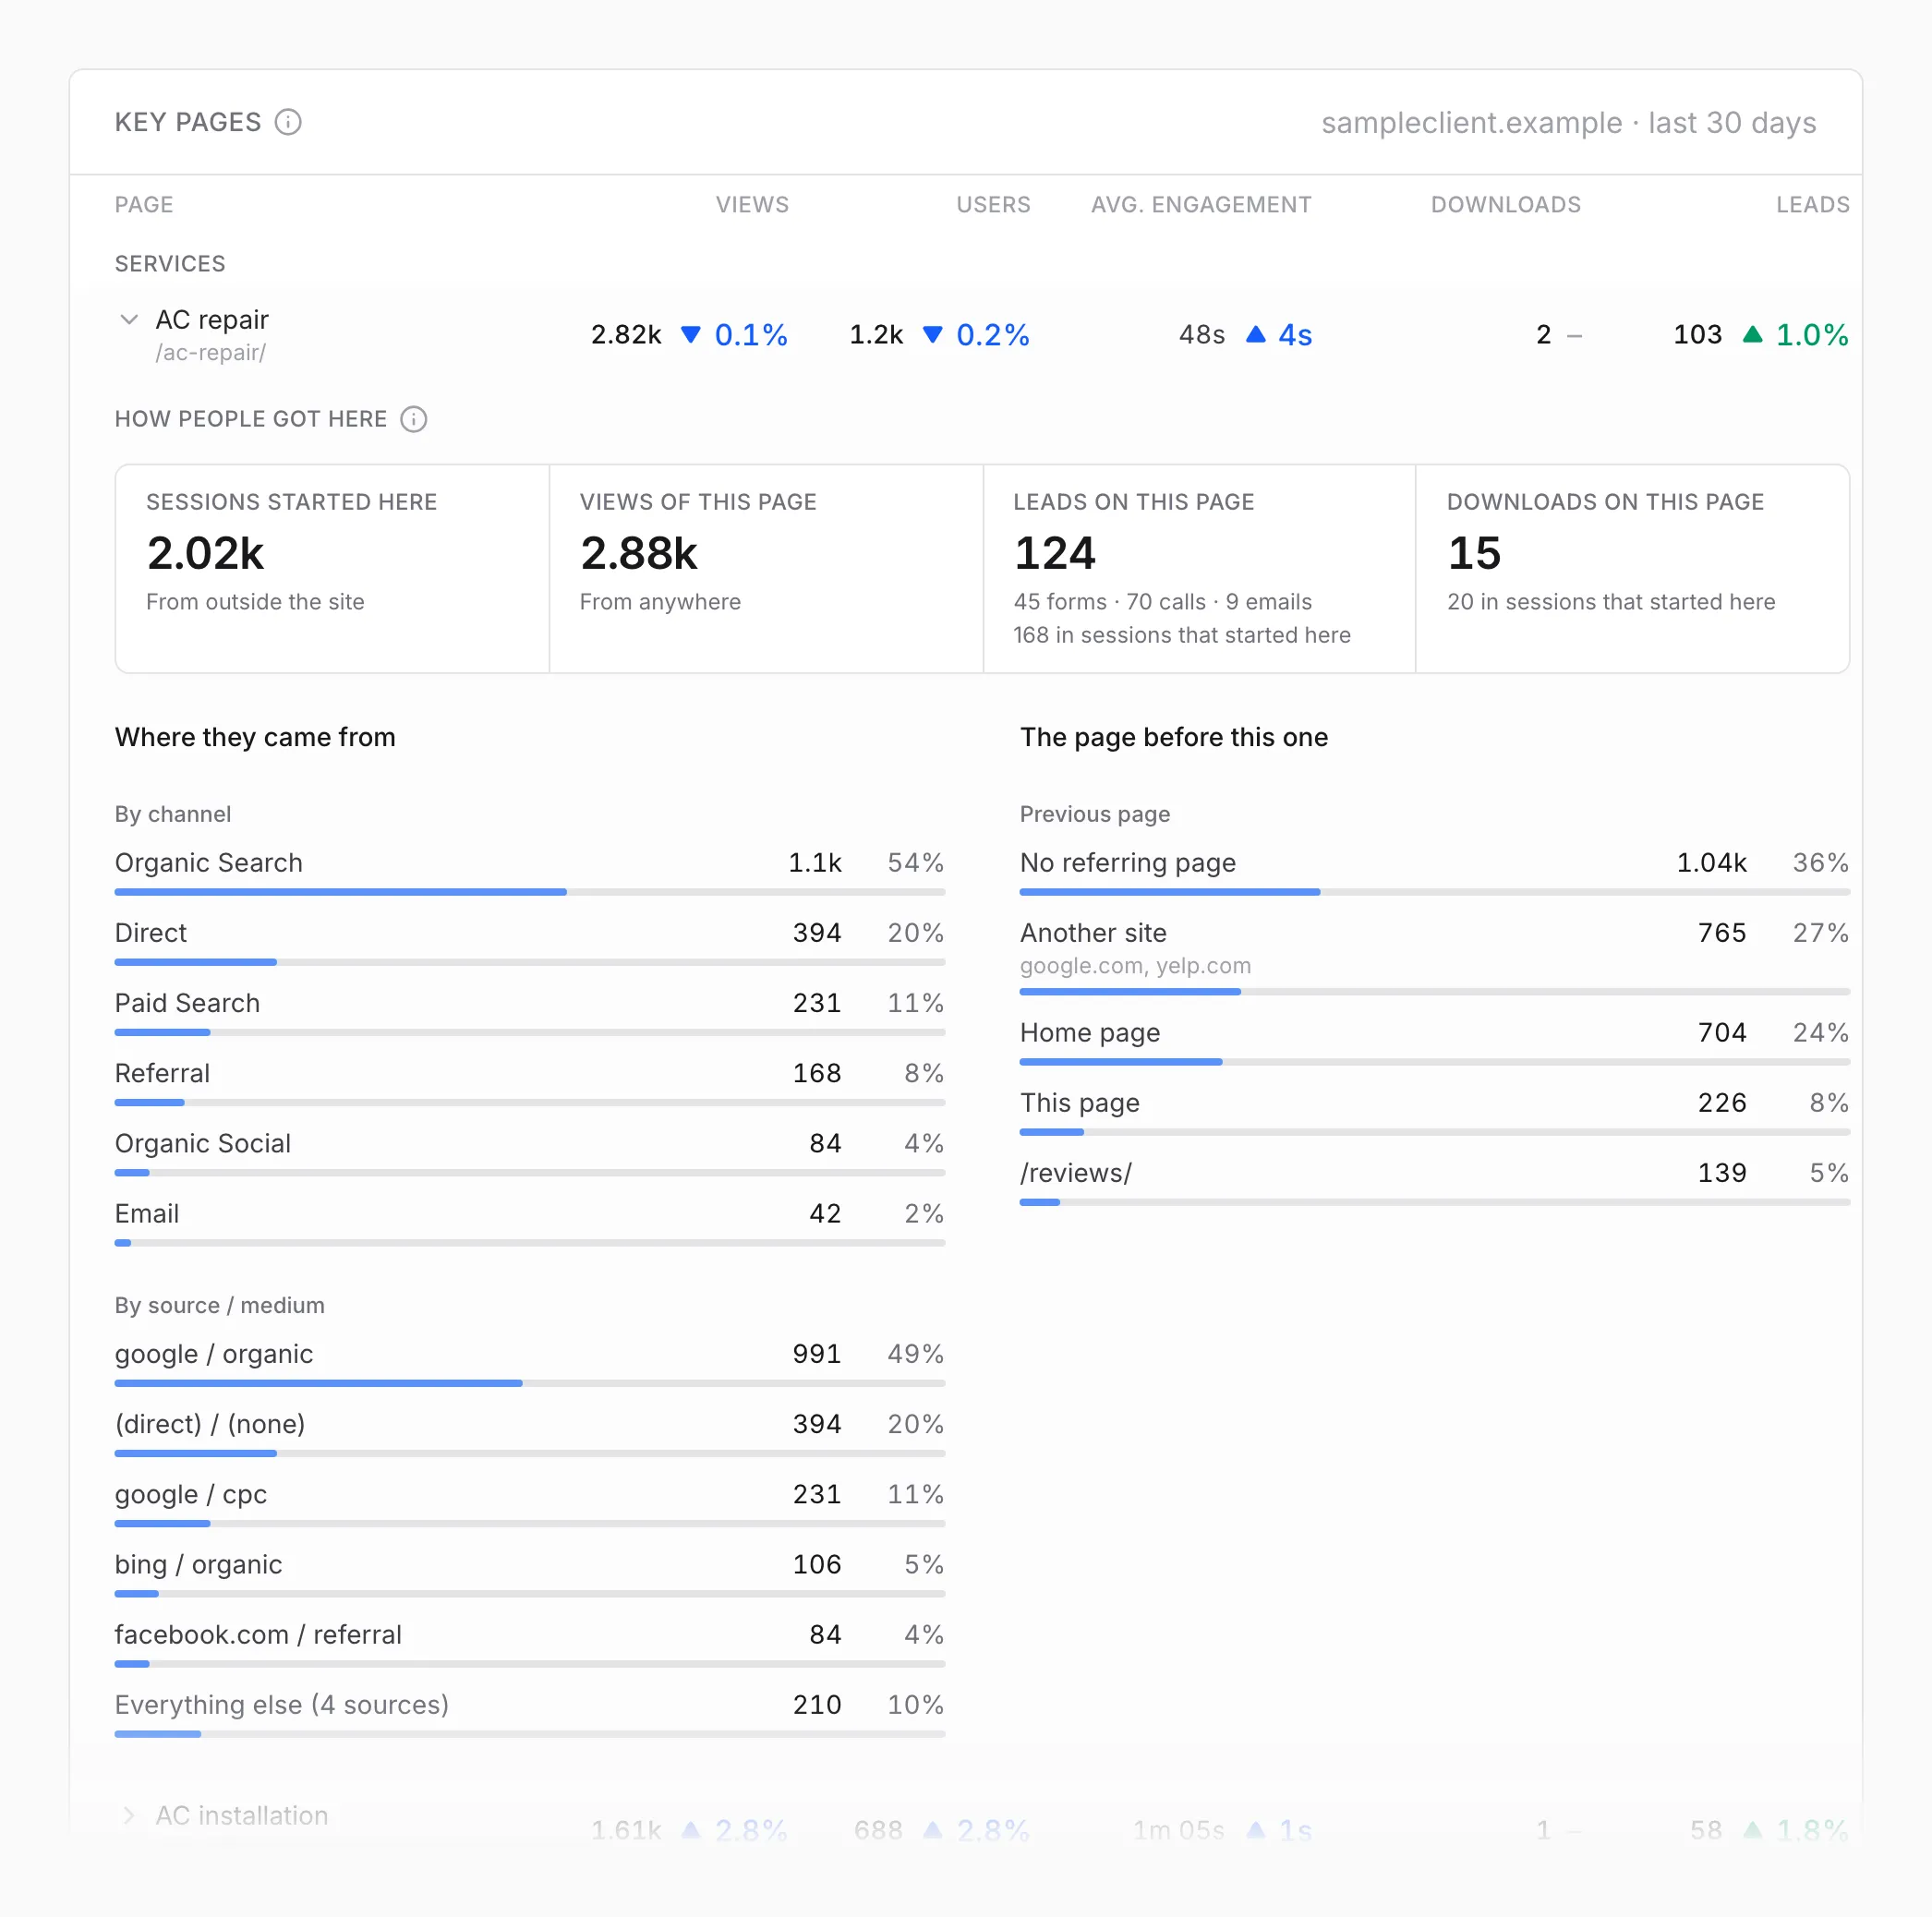
- The tiles count the visits that started on this page, every view of it, and the leads and downloads that happened on it. The line under leads and downloads counts them anywhere in the visits that started here, wherever on the site those visits ended up.
- Where they came from splits the visits that started here by channel and by source. “google / organic” is unpaid Google search, “google / cpc” is Google Ads, and “(direct) / (none)” means Google Analytics couldn’t tell.
- The page before this one shows what people viewed just before this page. “No referring page” means the browser didn’t say, “This page” is a reload or a return to it, and “Another site” names the sites that linked here.
The bar under each row shows its share of the total. This panel covers the range you picked, without a comparison.
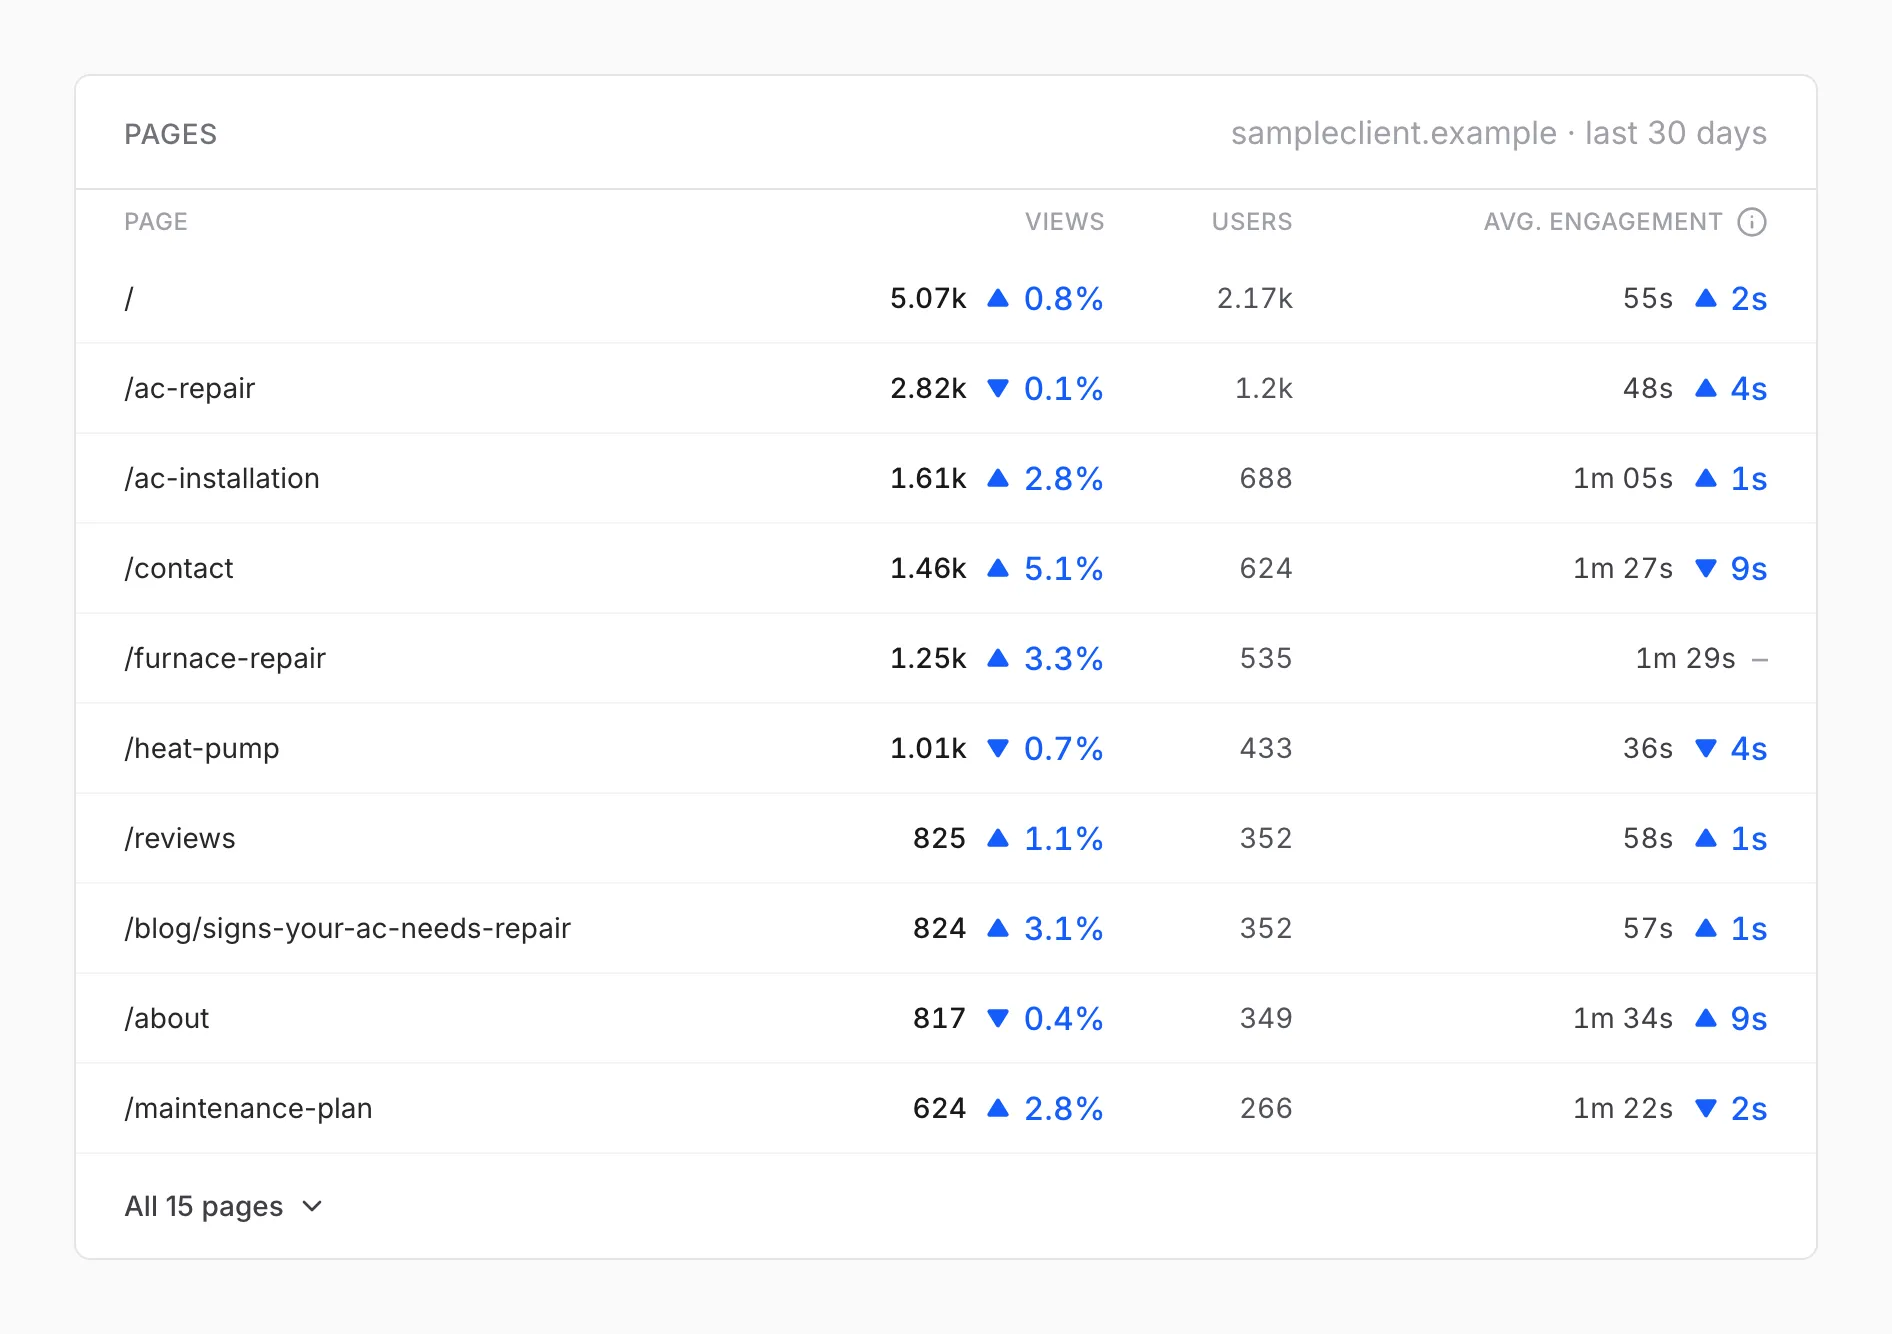
The most viewed pages on your site in the range. It shows the top 10, and the button at the bottom opens the rest of the list.
Why these numbers differ from Google Analytics
Section titled “Why these numbers differ from Google Analytics”The dashboard counts visits from the countries your business serves, plus visits with no country. Google Analytics’ own reports include every country, so they’re higher, sometimes by a lot when a site gets bot traffic from overseas.
The dashboard also counts only the conversions we track for you, and its page tables include only your own website, not booking tools or test sites that report into the same property.